Pi Network Hits All-Time High as Trading Volume Surges


Pi Network (PI) has skyrocketed more than 70% in the last 24 hours, propelling its market capitalization to $16 billion and its volume to more than $2.3 billion in the last 24 hours.
Despite reaching new all-time highs near $3, this technical divergence suggests a volatile path ahead for PI. Traders are watching closely as the token navigates between bullish momentum that could drive it toward $4 and warning signs that might trigger a pullback to support levels as low as $1.7 or even $0.79.
Pi Network DMI Shows the Uptrend Is Very Strong
The Pi Network’s Directional Movement Index (DMI) is showing remarkable momentum, with its Average Directional Index (ADX) surging to 57.7 from just 12.3 a day ago.
The ADX is a key technical indicator that measures the strength of a trend regardless of its direction. Readings below 20 generally indicate a weak trend, 20-40 suggest a moderate trend, and values above 40 signal a strong trend.
This dramatic increase in Pi’s ADX from weak to very strong territory indicates a significant intensification in the underlying trend’s strength.
Complementing this ADX surge, Pi’s Positive Directional Indicator (+DI) climbed sharply to 40.9 from 14.6 two days ago, while its Negative Directional Indicator (-DI) plummeted to 1.1 from 19.4 in the same period.
When +DI is significantly higher than -DI, as is currently the case with Pi, it confirms a strong bullish trend. The combination of a high ADX value with a wide spread between +DI and -DI suggests Pi Network is experiencing a particularly powerful uptrend with minimal selling pressure.
If these technical signals maintain their current configuration, they could indicate continued upward price movement for Pi in the near term, as the market appears to be under strong buying control with minimal resistance.
PI BBTrend Is Negative Despite the Price Surge
Despite the ongoing price surge, Pi’s Bollinger Bands Trend indicator (BBTrend) has plummeted to -11, marking a dramatic decline from its reading of 51.2 just three days ago, after hovering between 1 and 3 yesterday.
The BBTrend indicator is a specialized technical tool that measures price movement relative to Bollinger Bands. It essentially quantifies how price is trending within these volatility-based channels.
Positive readings indicate upward price movement relative to the bands, while negative values suggest downward movement or reversion toward the middle band.
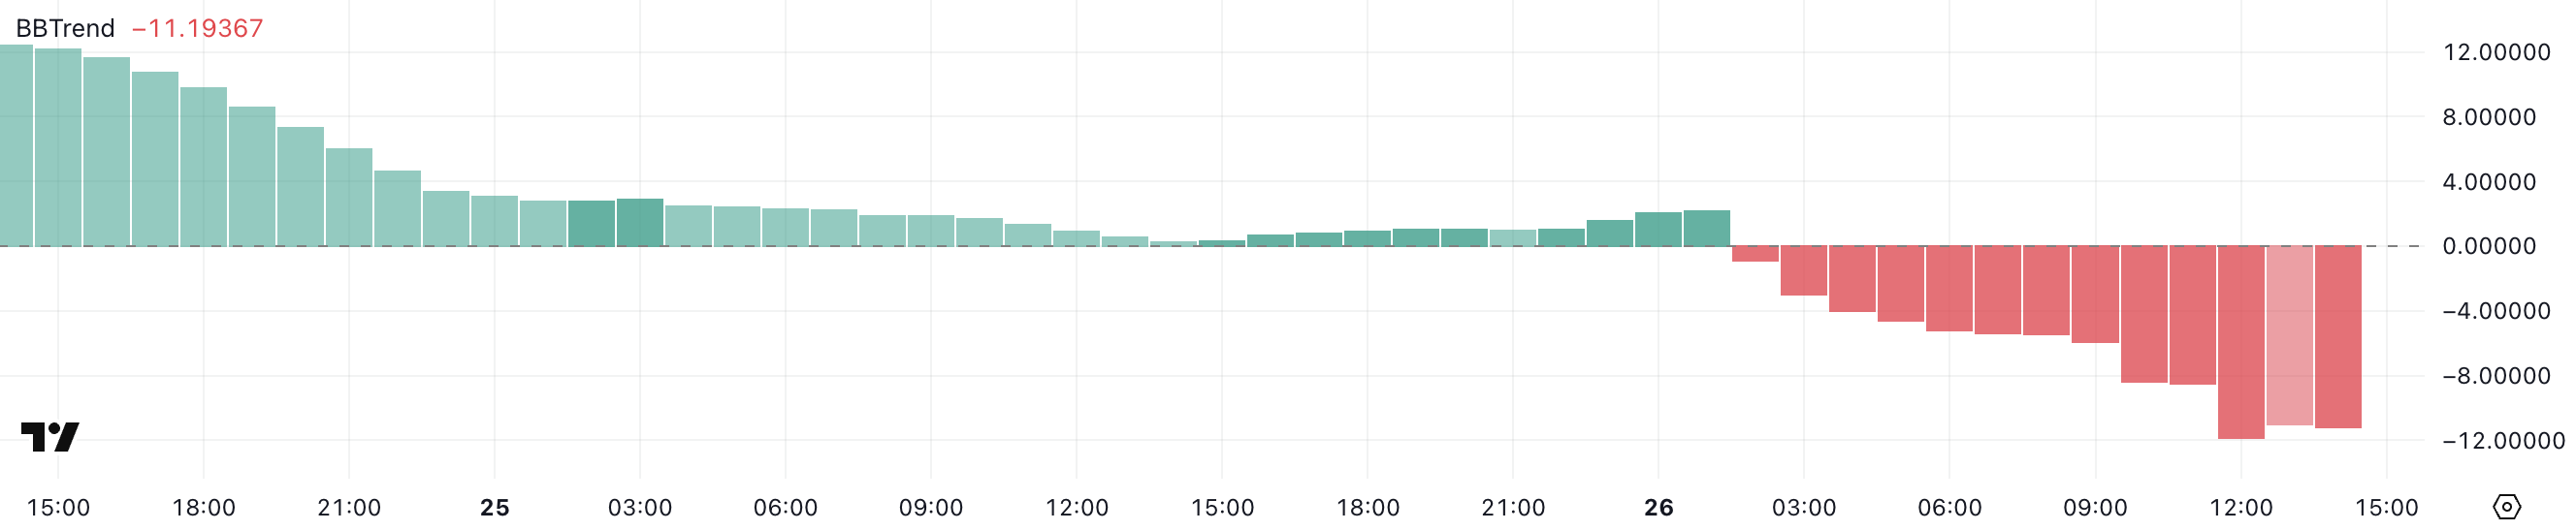
This sharp decline to -11 in Pi’s BBTrend could signal that the current uptrend is becoming significantly overextended and potentially vulnerable to a correction or consolidation phase.
When BBTrend turns notably negative after a price surge, it often indicates that the asset has moved too far too quickly and is now trading at levels that may be unsustainable in the short term.
This technical warning sign suggests that Pi might experience a pullback toward its middle Bollinger Band, a period of sideways consolidation, or at minimum, a deceleration in its upward momentum.
Can Pi Network Reach $4 In March?
Pi Network price reached new all-time highs just hours ago as its price approached the $3 mark for the first time.
With this strong upward momentum, Pi could potentially continue its ascent, breaking through the $3 psychological barrier and testing higher resistance levels at $3.5 or even $4 in the near term.
This impressive rally demonstrates growing market interest and buying pressure that could sustain further upside if the positive sentiment persists.
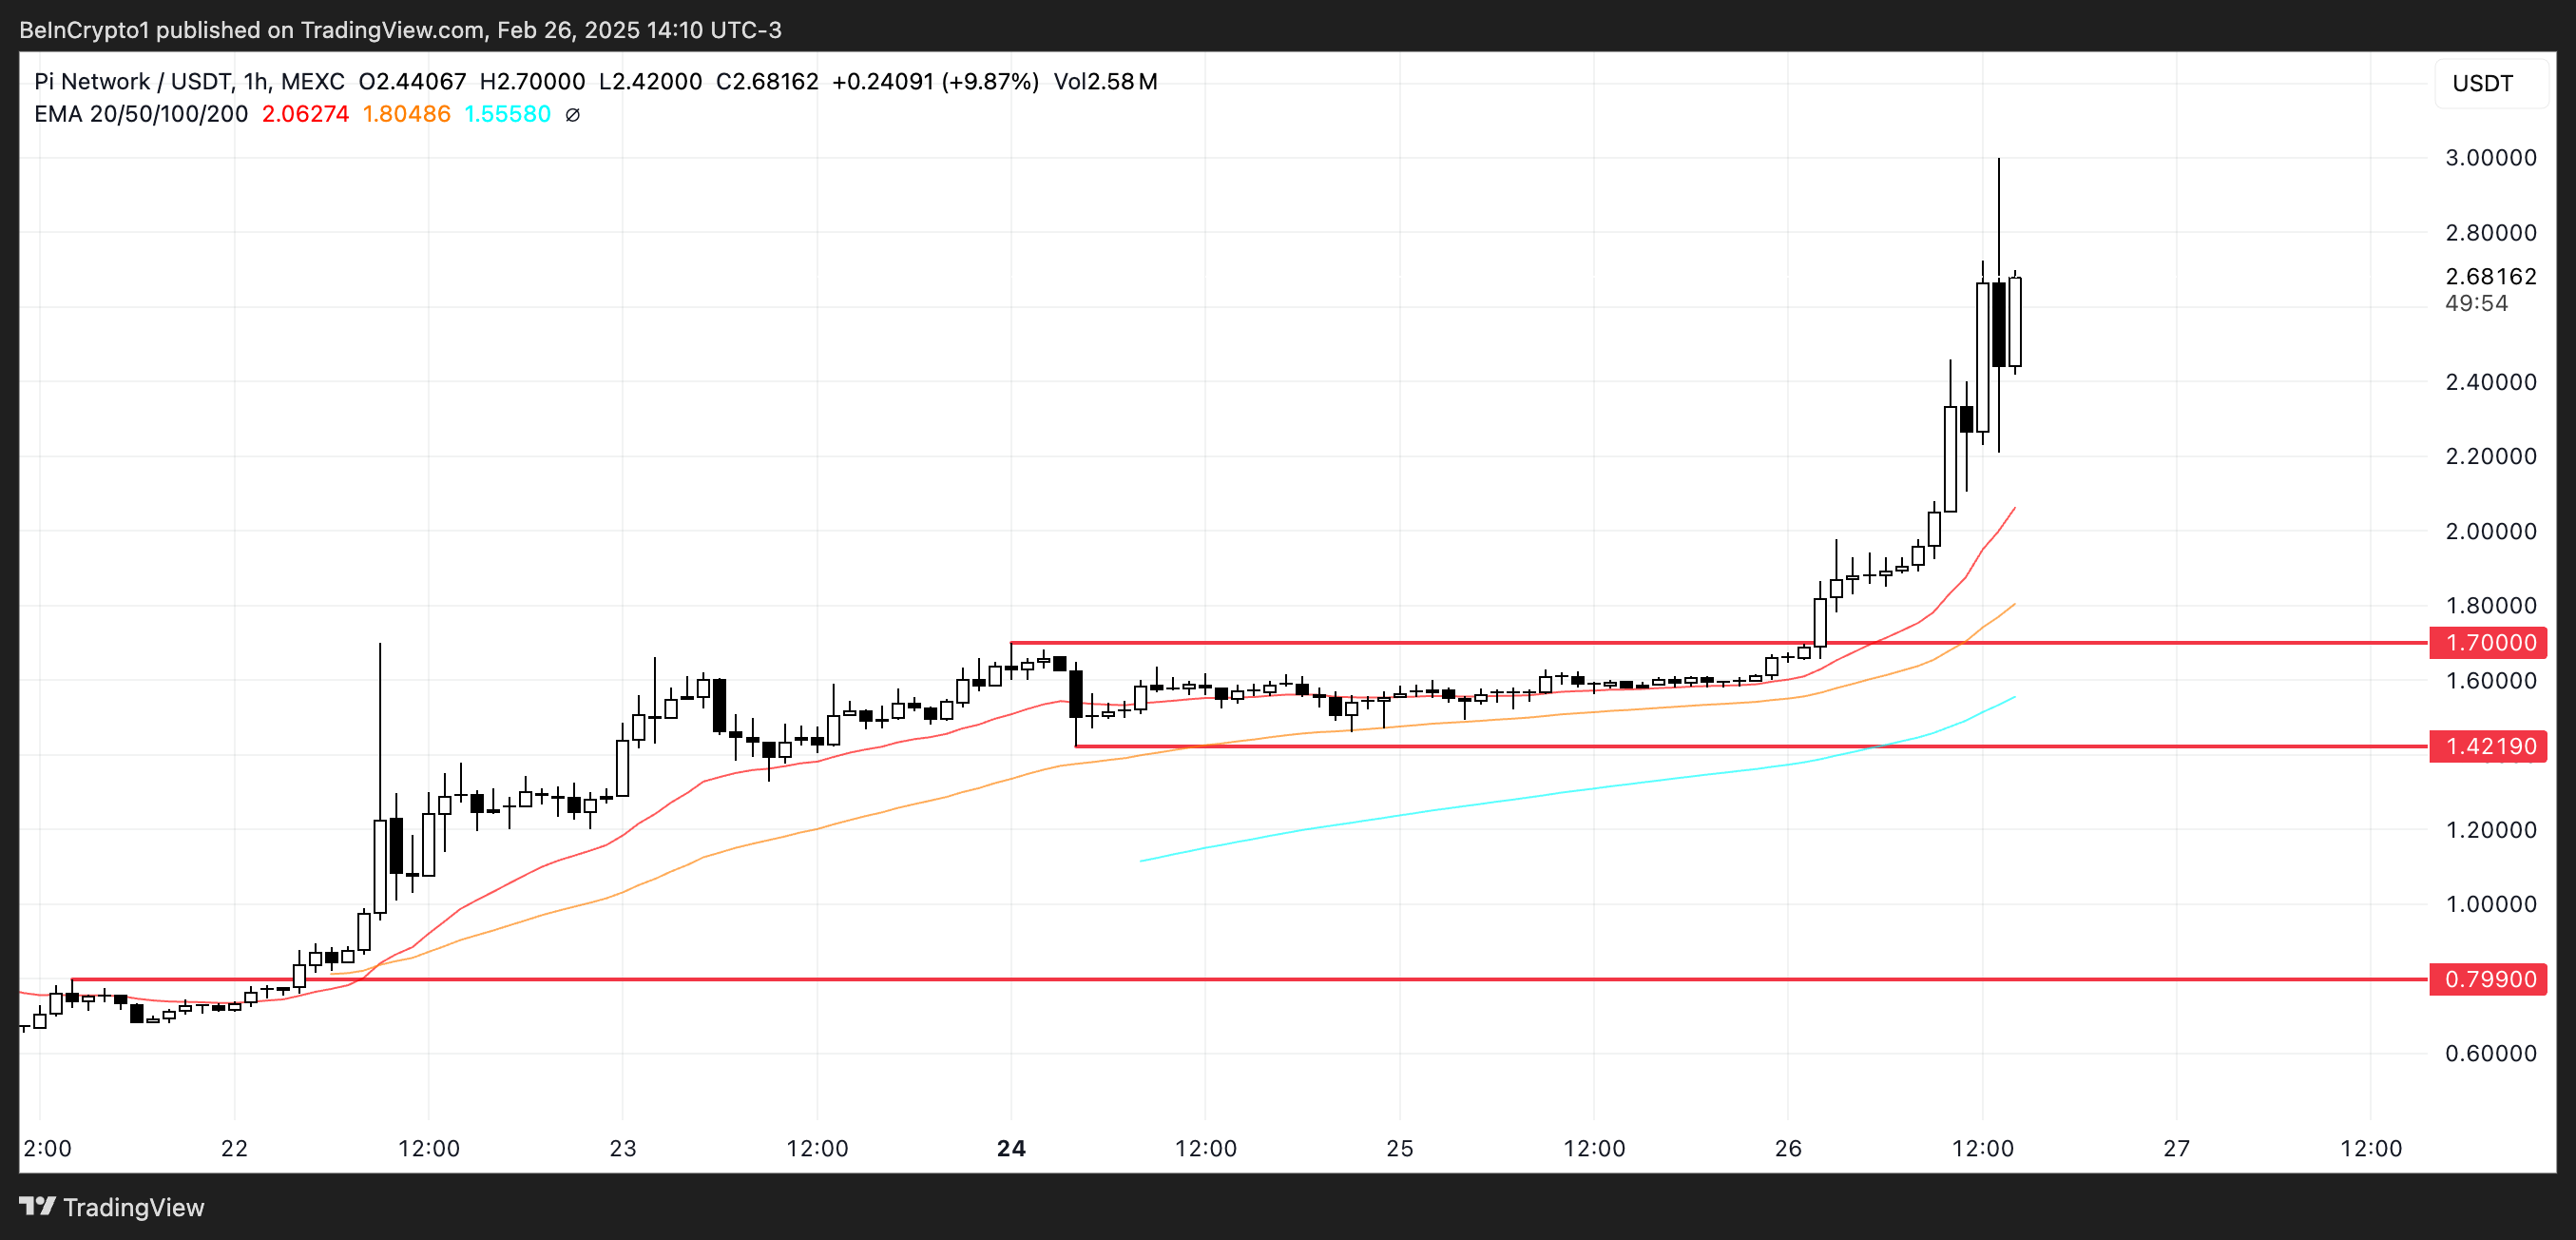
However, as indicated by the negative BBTrend reading, this rally may be overextended and at risk of reversal. Should the downward technical signal materialize into price action, Pi could experience a substantial correction, initially falling to test support at $1.7.
If this level fails to hold, further declines to $1.42 become likely as selling pressure intensifies.
In a scenario where a strong downtrend takes hold, Pi’s price might experience an even more dramatic pullback to $0.79, which would represent its lowest level in five days and a significant retracement from current highs.
Disclaimer
In line with the Trust Project guidelines, this price analysis article is for informational purposes only and should not be considered financial or investment advice. BeInCrypto is committed to accurate, unbiased reporting, but market conditions are subject to change without notice. Always conduct your own research and consult with a professional before making any financial decisions. Please note that our Terms and Conditions, Privacy Policy, and Disclaimers have been updated.