Cardano (ADA) Bulls Stand Firm Despite Slowing Momentum


Cardano (ADA) is up more than 12% over the last seven days and is now trading above $0.70 for the first time since the end of March. Trading volume is also rising, up 33% in the past 24 hours to reach $723 million.
Despite the price recovery, some technical indicators suggest that ADA’s momentum is weakening and approaching key decision points. Here’s a closer look at Cardano’s current setup as the new week begins.
Cardano BBTrend Weakens After Positive Streak
Cardano BBTrend indicator is currently at 7.55, down from 13.27 just three days ago. This sharp decline shows that the strength of recent price expansion has cooled, even though the asset has posted positive daily closes over the last four days.
The falling BBTrend suggests that while ADA has been moving higher, the expansion’s underlying momentum is losing intensity.
This shift highlights a potential slowdown that could impact ADA’s ability to sustain further gains without renewed buying pressure.
The BBTrend, or Bollinger Band Trend indicator, measures the strength of a price trend based on the expansion or contraction of Bollinger Bands.
A rising BBTrend typically signals strong momentum and increasing volatility, while a falling BBTrend suggests weakening momentum or the start of a consolidation phase.
With ADA’s BBTrend now at 7.55, the indicator still points to some positive momentum, but at a much weaker pace than earlier in the week.
If the BBTrend continues to decline, ADA could enter a consolidation phase, but if buying pressure returns, the token could extend its current positive streak.
ADA Faces Indecision as Buyers and Sellers Battle for Control
Cardano Directional Movement Index (DMI) shows its Average Directional Index (ADX) currently sitting at 17.14, a notable drop from 31 two days ago.
This sharp decrease signals that the strength of ADA’s recent trend has weakened significantly. Meanwhile, the +DI (positive directional indicator) is at 19.95, up from 15.96 a few hours ago but still down from 26 two days ago.
The -DI (negative directional indicator) sits at 19.07, slightly down from 21.16 earlier but up compared to 14.49 two days ago, reflecting mixed momentum between buyers and sellers.
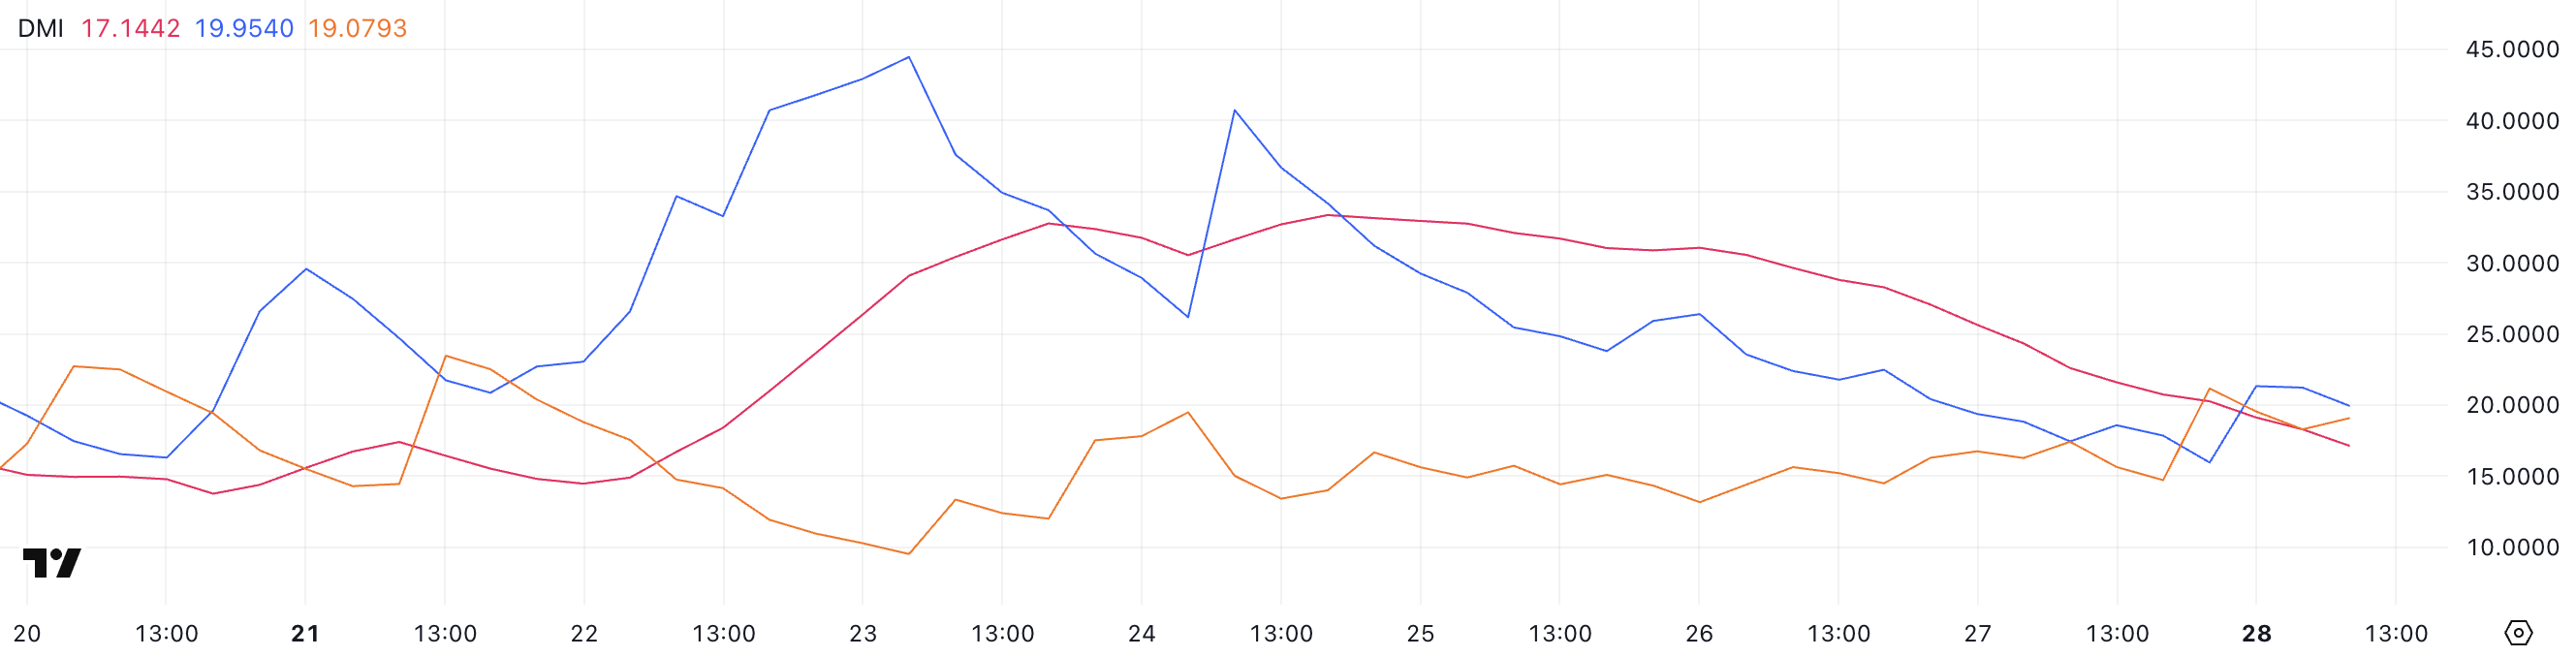
The ADX measures the strength of a trend without indicating its direction.
Readings above 25 typically suggest a strong trend, while readings below 20 point to a weak or consolidating market. With ADA’s ADX now at 17.14, trend strength is weak, and neither buyers nor sellers currently have a clear advantage.
The close values between +DI and -DI suggest that Cardano could enter a period of sideways movement unless either bulls or bears regain stronger control soon.
Cardano’s Bullish Structure Faces Critical Test Near $0.69
Cardano’s Exponential Moving Average (EMA) lines suggest an uptrend, with the short-term EMAs positioned above the long-term ones.
However, Cardano price has repeatedly tested the support level at $0.69 and is trading very close to it.
This price action signals that while the broader trend remains positive, the bullish momentum has weakened, and the $0.69 support is becoming a critical zone.
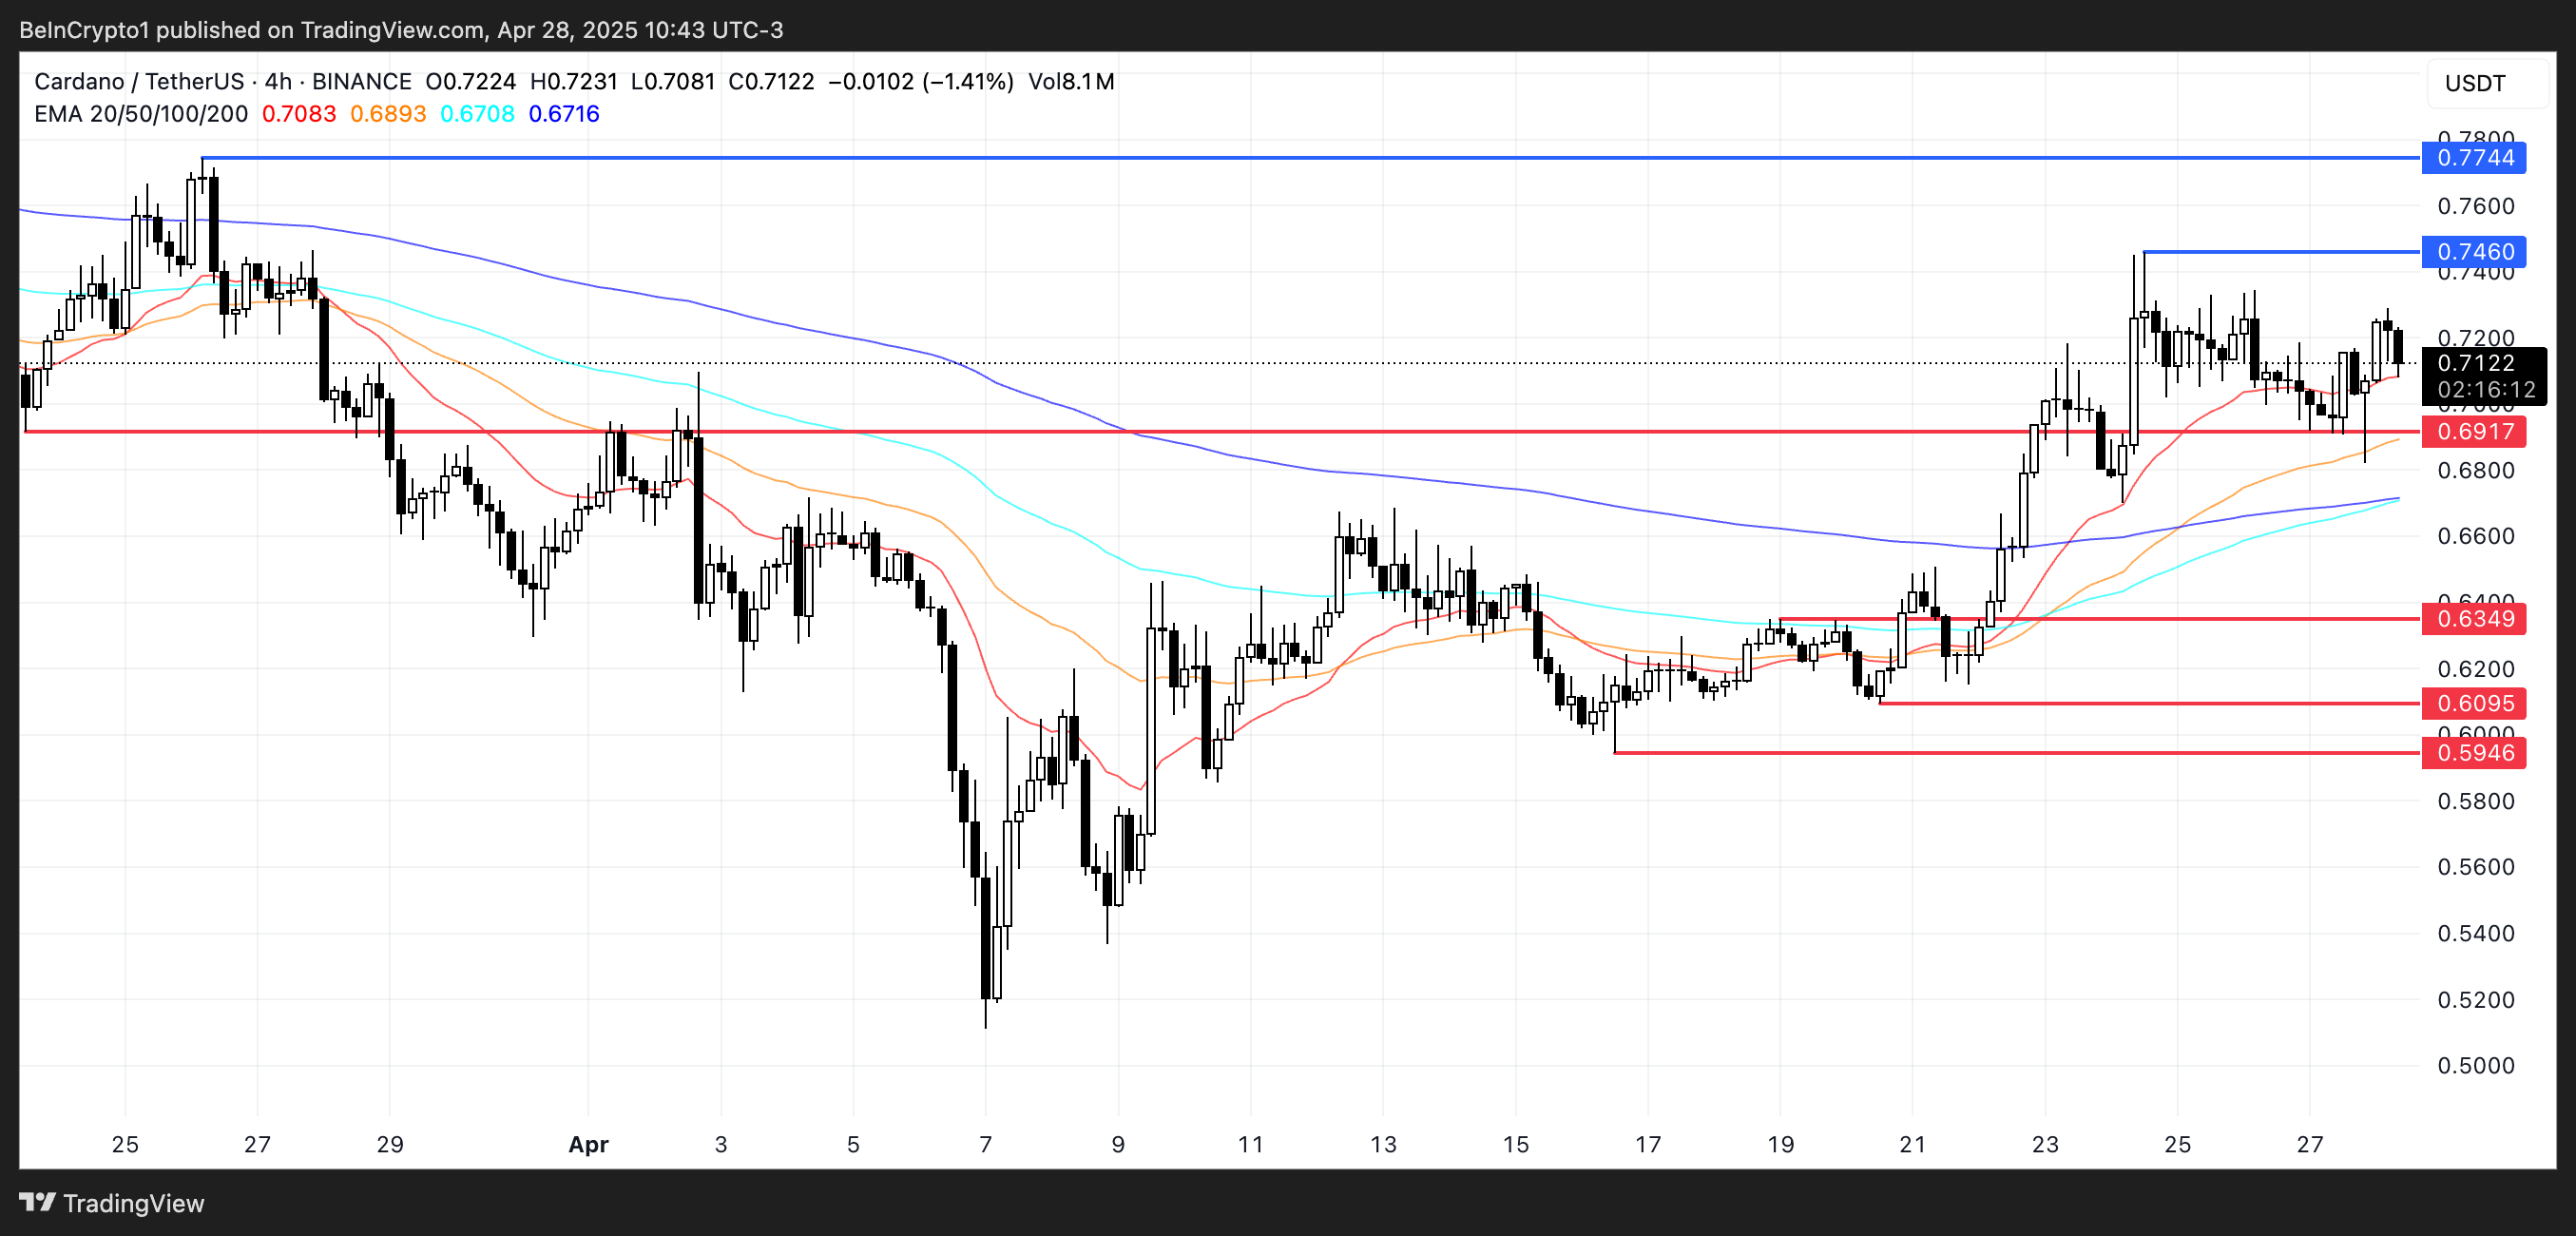
If ADA loses the $0.69 support, the next downside targets would be around $0.63, followed by $0.609 and potentially $0.59 if selling pressure accelerates.
On the other hand, if buyers step back in and reinforce the uptrend, ADA could rally to retest resistance at $0.746.
A breakout above $0.746 could open the door for a move toward $0.77, offering a strong bullish setup if momentum strengthens again.
Disclaimer
In line with the Trust Project guidelines, this price analysis article is for informational purposes only and should not be considered financial or investment advice. BeInCrypto is committed to accurate, unbiased reporting, but market conditions are subject to change without notice. Always conduct your own research and consult with a professional before making any financial decisions. Please note that our Terms and Conditions, Privacy Policy, and Disclaimers have been updated.