Bitcoin UTXO Profit/Loss Ratio Sits Below Critical Levels – How Long Until BTC Overheats?


Bitcoin is on the verge of entering uncharted territory after briefly tagging the $108,000 level earlier today. The flagship cryptocurrency has surged more than 40% since early April, fueled by rising market optimism and institutional demand. However, price is showing hesitation near the all-time high (ATH), now consolidating around $106,000. This key level is acting as both resistance and a psychological barrier, creating mixed sentiment across the market.
While many analysts remain bullish, calling for a breakout that could take Bitcoin into price discovery, others are cautioning against premature euphoria, pointing to the potential for a sharp retrace if momentum stalls. Top analyst Axel Adler shared insights suggesting that every strong price acceleration shifts a significant volume of coins from loss into profit, an event that typically pushes the 30-day simple moving average (SMA) of the UTXO profit-to-loss ratio above 200. That level has historically marked overheated conditions and preceded major corrections.
As of now, the metric sits at 99, indicating that the market has not yet entered a phase of overheating. This suggests that Bitcoin still has room to run before sentiment becomes excessive, leaving the door open for further upside—or a critical rejection.
Momentum Or Correction? Key Metric Suggests Bitcoin Still Has Room to Run
This is a pivotal week for Bitcoin and the entire crypto market, with price action set to determine the direction of the coming weeks. After reaching the $107,000 mark on Sunday, Bitcoin was quickly rejected, retracing more than 4% and settling around $106,000. That fakeout highlighted the market’s fragility near the all-time high (ATH) zone. A clean breakout above $109,000 would confirm the continuation of the powerful bullish trend that began in 2023. But if Bitcoin loses current levels and falls below key demand, it could trigger a deeper correction, shaking bullish conviction.
Adler provided key insight into market sentiment by analyzing the UTXO profit-to-loss ratio. Historically, every strong acceleration in price that rapidly shifts coins from loss into profit causes the 30-day simple moving average (SMA) of this metric to spike above 200, signaling overheating and often marking the start of a distribution phase. At present, the SMA sits at 99, well below the warning threshold, indicating no signs of excess yet.

Adler points out that while Bitcoin still has room to grow, the “easy fuel” behind recent gains is fading. A much stronger push or more volatile price action will be needed to drive the metric higher. Interestingly, this aligns with a larger pattern—this cycle’s third compression phase. If the analogy holds, this coiled spring may soon release energy powerful enough to send Bitcoin well beyond its ATH, but the risk of rejection remains very real.
Technical Analysis: Key Weekly Price Action
Bitcoin is trading at $106,394 after reaching a local high of $108,035 earlier today. The chart shows BTC holding above the $103,600 breakout level, now acting as a strong support zone. Price action confirms a bullish structure, with higher highs and higher lows forming over the past few weeks. The 200-day SMA at $93,186 and the 200-day EMA at $88,855 remain well below the current price, reinforcing the strength of the ongoing uptrend.
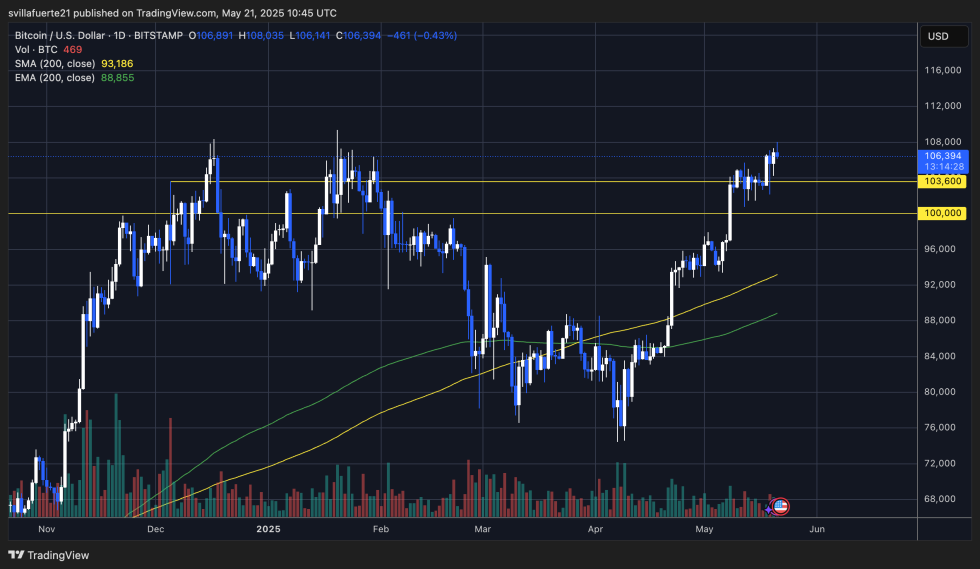
However, price is now consolidating below all-time highs, with clear resistance near the $109,000 level. This area marks a crucial test for bulls. Breaking above it would confirm a move into price discovery and could trigger a wave of momentum buying. On the other hand, failure to push higher may result in a retest of the $103,600 or even the $100,000 psychological level.
Volume has remained moderate despite the recent rally, suggesting that a strong breakout will require higher participation. The structure currently resembles a high consolidation zone, often a precursor to a volatile move. Bulls remain in control for now, but any drop below $103,600 would weaken short-term momentum and potentially trigger a broader retracement. All eyes remain on BTC’s behavior around the ATH zone.
Featured image from Dall-E, chart from TradingView

Editorial Process for bitcoinist is centered on delivering thoroughly researched, accurate, and unbiased content. We uphold strict sourcing standards, and each page undergoes diligent review by our team of top technology experts and seasoned editors. This process ensures the integrity, relevance, and value of our content for our readers.