Bitcoin Moves With Gold And M2 Money Supply – Next Rally Loading?


Bitcoin (BTC) is increasingly mirroring gold’s historic price performance and the trajectory of the global M2 money supply, prompting crypto analysts to forecast a potential major rally for the world’s leading cryptocurrency.
Bitcoin Following Gold, M2 Money Supply
In an X post shared earlier today, crypto analyst Jelle shared the following chart that reveals a recurring pattern – gold tends to lead Bitcoin, which subsequently “catches up” in price action. This relationship underscores the growing perception of BTC as digital gold.
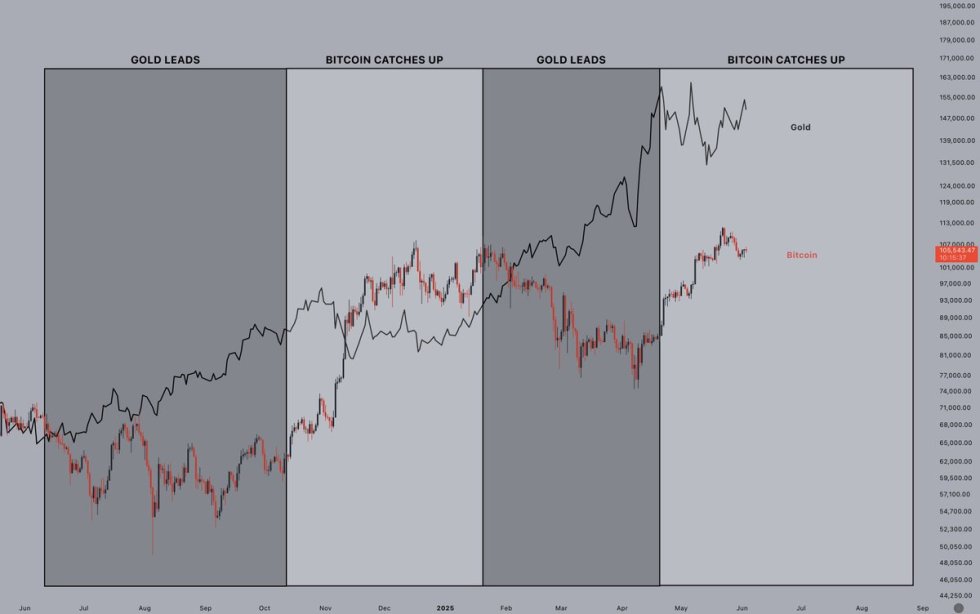
Historically, Bitcoin’s price movements have aligned with those of gold, driven by similar macroeconomic dynamics such as inflation, expansive monetary policy, and investor demand for scarce assets. As gold continues to rally amid rising global liquidity and geopolitical tensions, Bitcoin appears to be following suit.
Bitcoin’s reputation as a store of value is also gaining traction among institutions. Robert Mitchnick, Head of Digital Assets at BlackRock, recently described BTC as a “superior alternative” to gold – a strong endorsement from the world’s largest asset manager.
Meanwhile, another analyst, CryptoGoos, drew attention to BTC’s tendency to follow shifts in the global M2 money supply. He noted that Bitcoin often lags behind increases in M2 by roughly two months, suggesting that the cryptocurrency may soon witness another rally.

For the uninitiated, the global M2 money supply refers to the total amount of money circulating in the economy, including cash, checking deposits, and other similar monetary instruments. An increase in M2 often signals monetary expansion, which can lead to inflation and push investors toward assets like gold and Bitcoin as hedges.
From a technical perspective, BTC is also showing bullish signs. In an X post today, seasoned analyst Titan of Crypto pointed out that Bitcoin has formed a golden cross on the four-hour chart.
This occurs when a short-term moving average (MA), typically the 50-day MA, crosses above a long-term average, such as the 200-day MA. The golden cross is widely regarded as a bullish indicator and may signal further upside.
New ATH Possible But Support Breakdown Risks Remain
Various metrics suggest that the BTC rally is far from over yet. For instance, Titan of Crypto recently stated that BTC is following the Golden Ratio Multiplier, targeting $130,000.
Similarly, crypto enthusiast KillaXBT predicted a BTC price of $120,000 by mid-June. However, there are some risks to monitor to avoid getting caught up in a price crash.
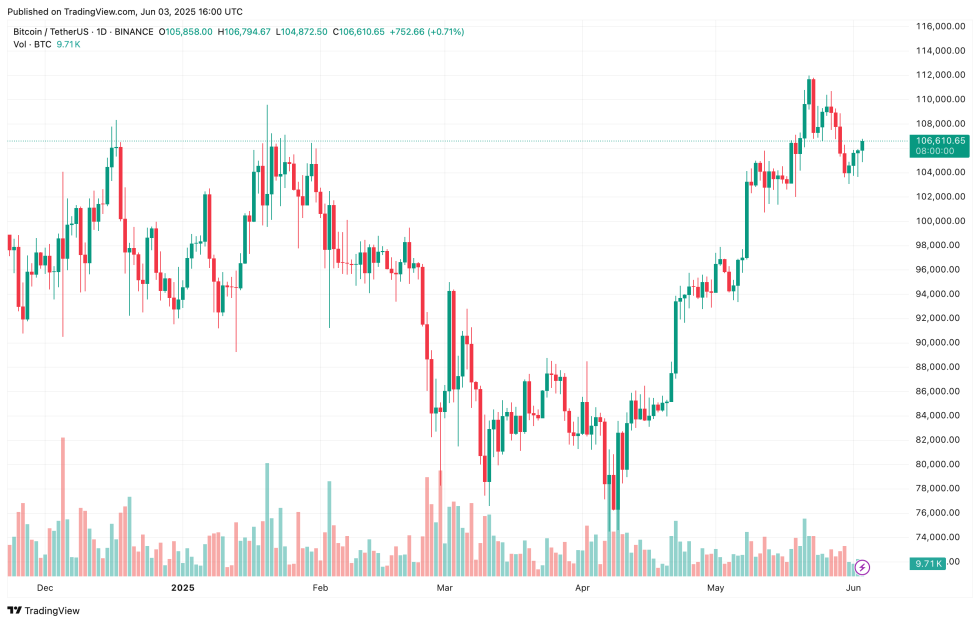
Analysts caution that if Bitcoin falls below the critical support range of $97,000 – $99,000, it could trigger a sharper correction. At press time, BTC trades at $106,610, up 2.2% in the past 24 hours.
Featured Image from Unsplash.com, charts from X and TradingView.com

Editorial Process for bitcoinist is centered on delivering thoroughly researched, accurate, and unbiased content. We uphold strict sourcing standards, and each page undergoes diligent review by our team of top technology experts and seasoned editors. This process ensures the integrity, relevance, and value of our content for our readers.