Bitcoin’s Long-Term Holders Resume Accumulation

As the broader crypto market begins to recover from recent lows, on-chain data reveals a growing behavioral divide between Bitcoin’s long-term and short-term holders.
Its Long-term holders (LTHs) have resumed net accumulation for the first time since the last local top, while short-term holders (STHs) appear to be exiting the market.
BTC LTHs Return to Accumulation as STHs Capitulate
In a new report, pseudonymous CryptoQuant analyst IT Tech noted that a clear behavioral divide has emerged between BTC’s LTHs and STHs, suggesting the early formation of a re-accumulation phase.
This is based on an assessment of BTC’s Net Position Change for Long-Term Holders (LTH), which, per the analyst, has now flipped positive for the first time since BTC’s last local peak.
“This suggests that experienced, conviction-driven participants are gradually returning to accumulation after several months of sustained distribution. Their activity often reflects strategic, cycle-aware repositioning, not necessarily whale-sized capital flows,” the analyst noted.
Meanwhile, BTC STHs—those who have held BTC for less than 155 days—are selling into weakness, with net outflows remaining firmly in negative territory. This trend suggests capitulation, as newer investors reduce their exposure to the coin in response to recent price troubles.
IT Tech noted that this behavioral divergence “tends to signal early stages of a re-accumulation phase.”
“Suppose long-term participants continue increasing their positions while short-term supply gets flushed out. This setup may serve as a constructive base for future price recovery, even if short-term price action remains choppy,” the analyst said.
Momentum Builds for Bitcoin as Buying Pressure Surges
On the daily chart, BTC’s positive Chaikin Money Flow (CMF) reflects increasing investor demand and positive cash flow momentum. This further reinforces the possibility of a bullish breakout as projected by the analyst.
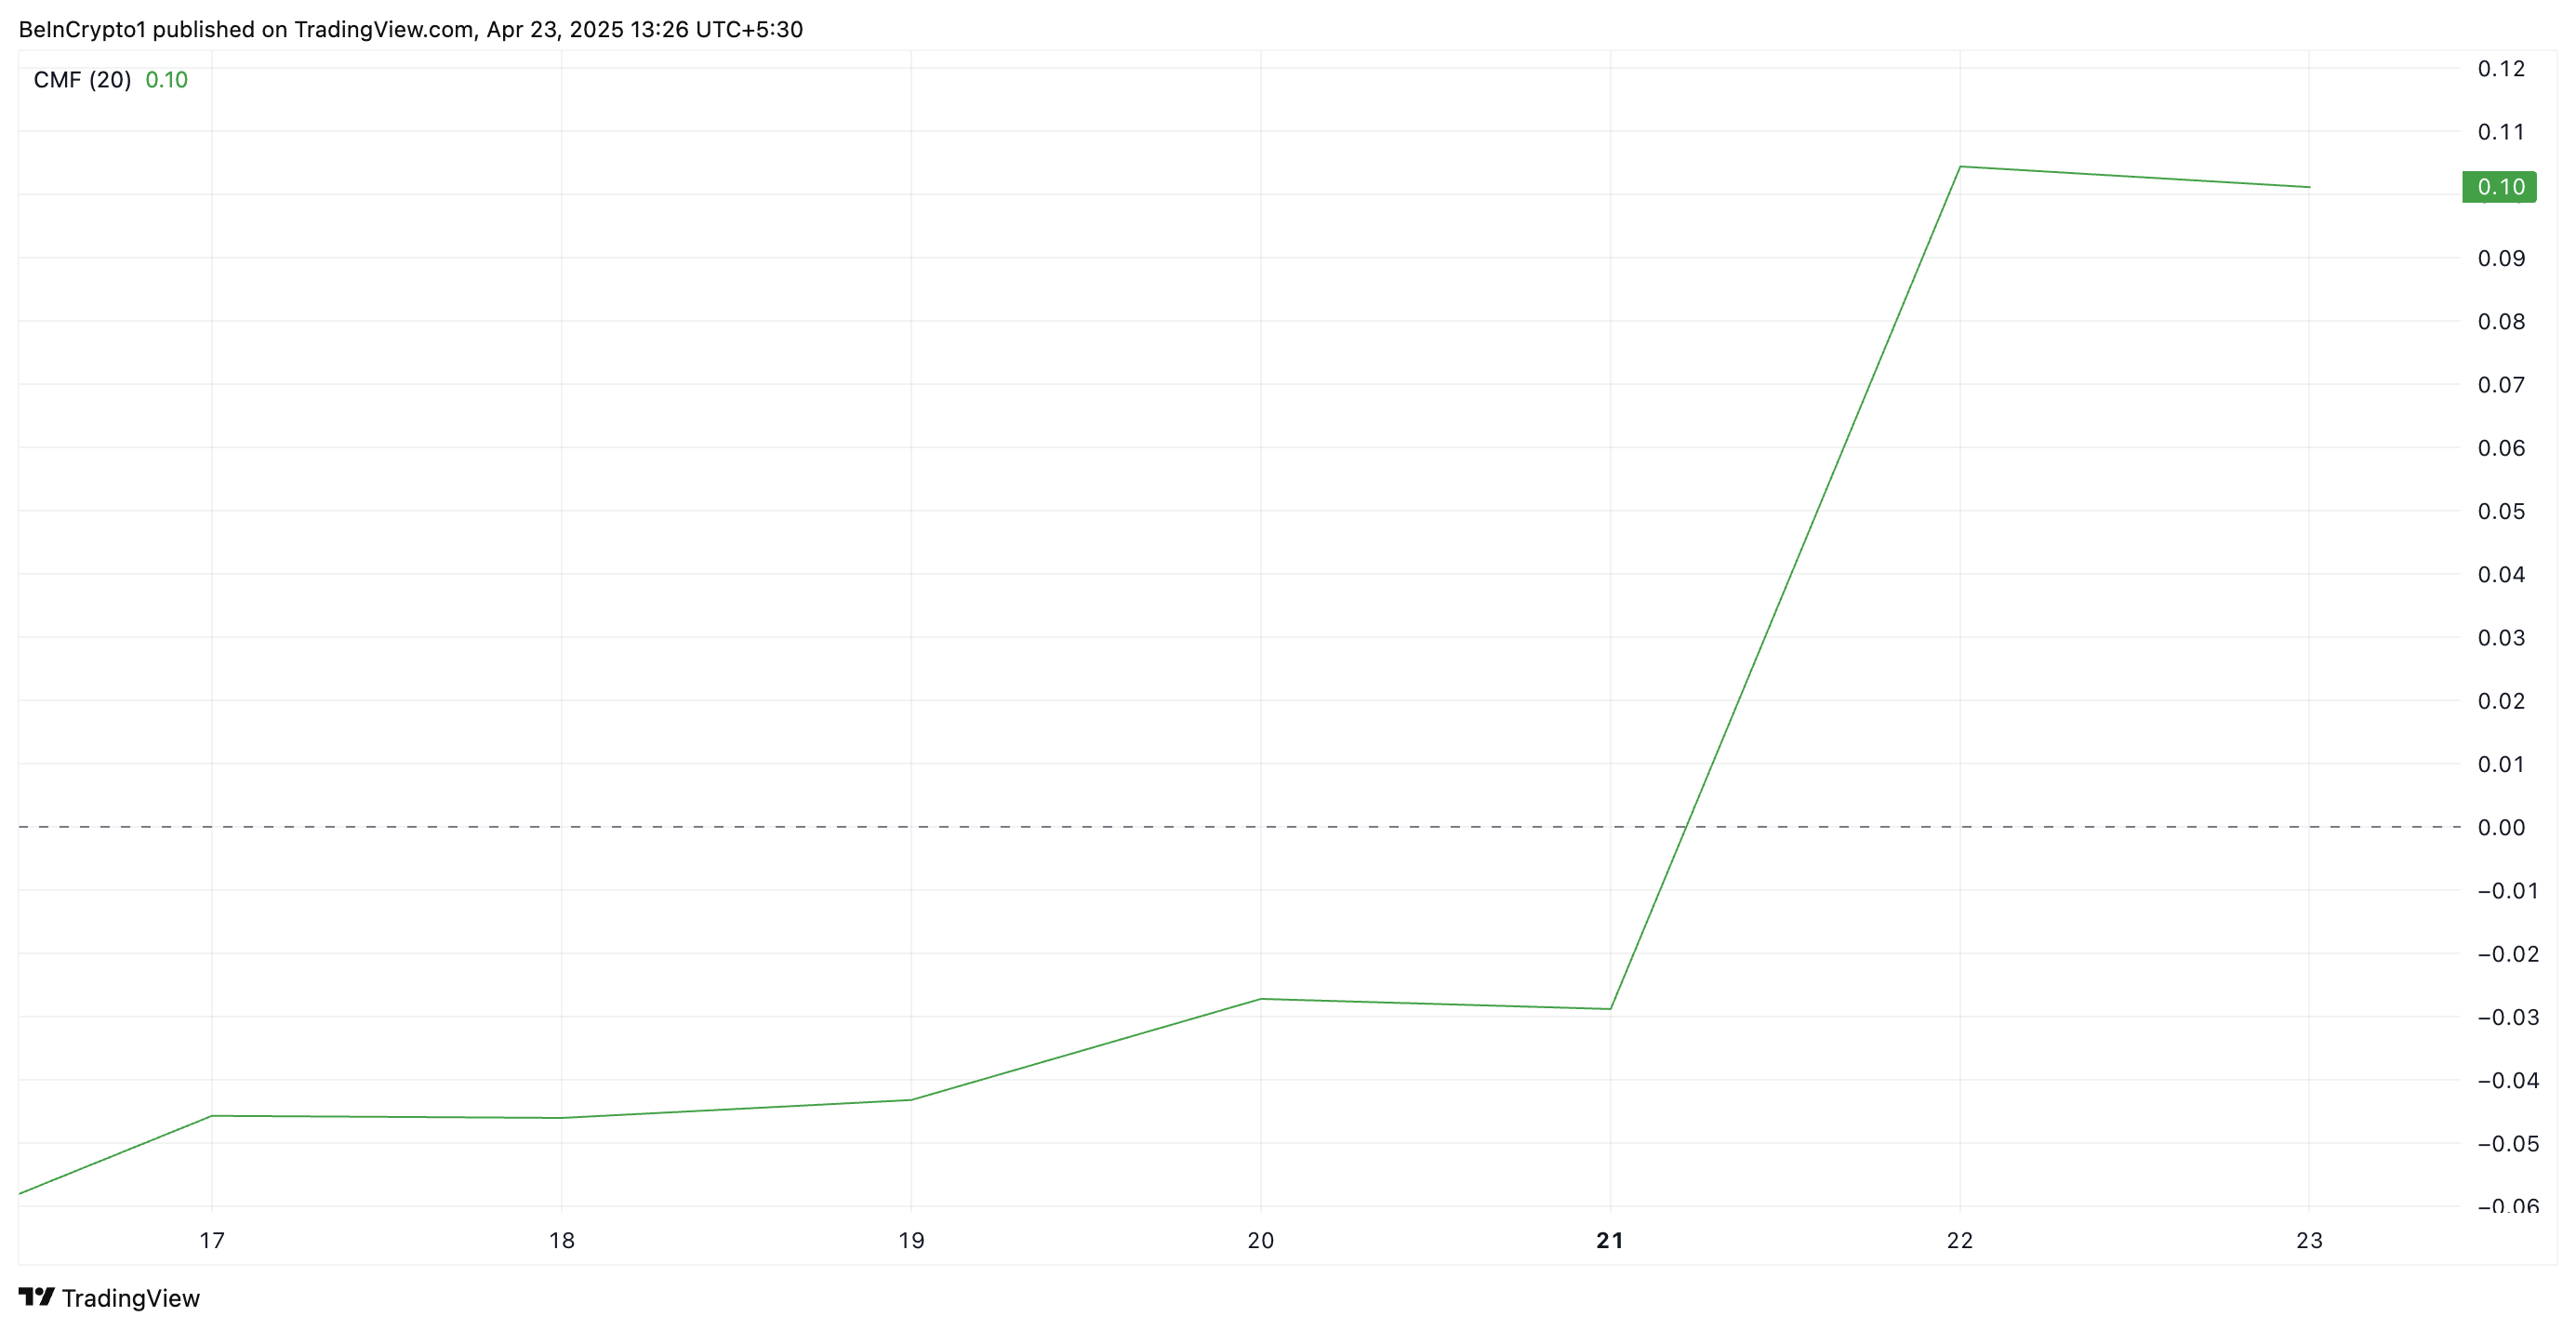
At press time, this momentum indicator, which measures how money flows into and out of an asset, is at 0.10. A positive CMF reading like this indicates that buying pressure outweighs selloffs among market participants and hints at an extended price growth for BTC.
Moreover, the coin’s Aroon Up Line currently sits at 100%, reinforcing the strength of its ongoing uptrend.

An asset’s Aroon Indicator measures the strength and direction of a trend by tracking the time since the highest and lowest prices over a given period. It comprises two lines: Aroon Up, which measures bullish momentum, and Aroon Down, which tracks bearish pressure.
As with BTC, when the Aroon Up line is at 100, it signals strong upward momentum and a dominant bullish trend. This suggests that buying pressure is high, and the price may continue rising.
BTC Bulls Eye New Highs
BTC now trades firmly above the key support formed at $91,851. If the bullish pressure holds and demand rockets, the king coin could continue its uptrend to exchange hands at $95,971.

However, if traders resume profit-taking, this bullish projection will be invalidated. In that scenario, BTC’s price could retest the support at $91,851. Should it fail to hold, its price could fall to reach $87,730.
Disclaimer
In line with the Trust Project guidelines, this price analysis article is for informational purposes only and should not be considered financial or investment advice. BeInCrypto is committed to accurate, unbiased reporting, but market conditions are subject to change without notice. Always conduct your own research and consult with a professional before making any financial decisions. Please note that our Terms and Conditions, Privacy Policy, and Disclaimers have been updated.