Cardano Holders Accumulate More ADA, Setting Stage for Rally


Cardano has traded within a tight range over the past week as the broader crypto market attempts a recovery. It has faced resistance at $0.75 and found support at $0.69.
Despite the price consolidation, on-chain data reveals a strengthening bullish bias that could pave the way for an upward breakout.
Cardano Stuck in a Range—HODLing Points to a Potential Breakout
Amid ADA’s sideways price movements over the past week, investors have increased their holding times. According to IntoTheBlock, holding time has increased by 77% during the review period.
This trend signals a preference for hodling rather than short-term selling.
An asset’s coin holding time is a metric that tracks the average duration of time its tokens are held in wallet addresses before being sold or transferred.
As this time spikes, it signals Cardano holders are opting to hold onto their assets rather than sell. This suggests growing confidence in the asset’s long-term potential. If the trend persists, it could reduce selling pressure and cause ADA to attempt a break above the resistance at $0.75.
Additionally, ADA’s Network Realized Profit/Loss (NPL) remains negative, meaning most Cardano holders would incur losses if they sold now. At press time, this indicator stands at -2.33 million.
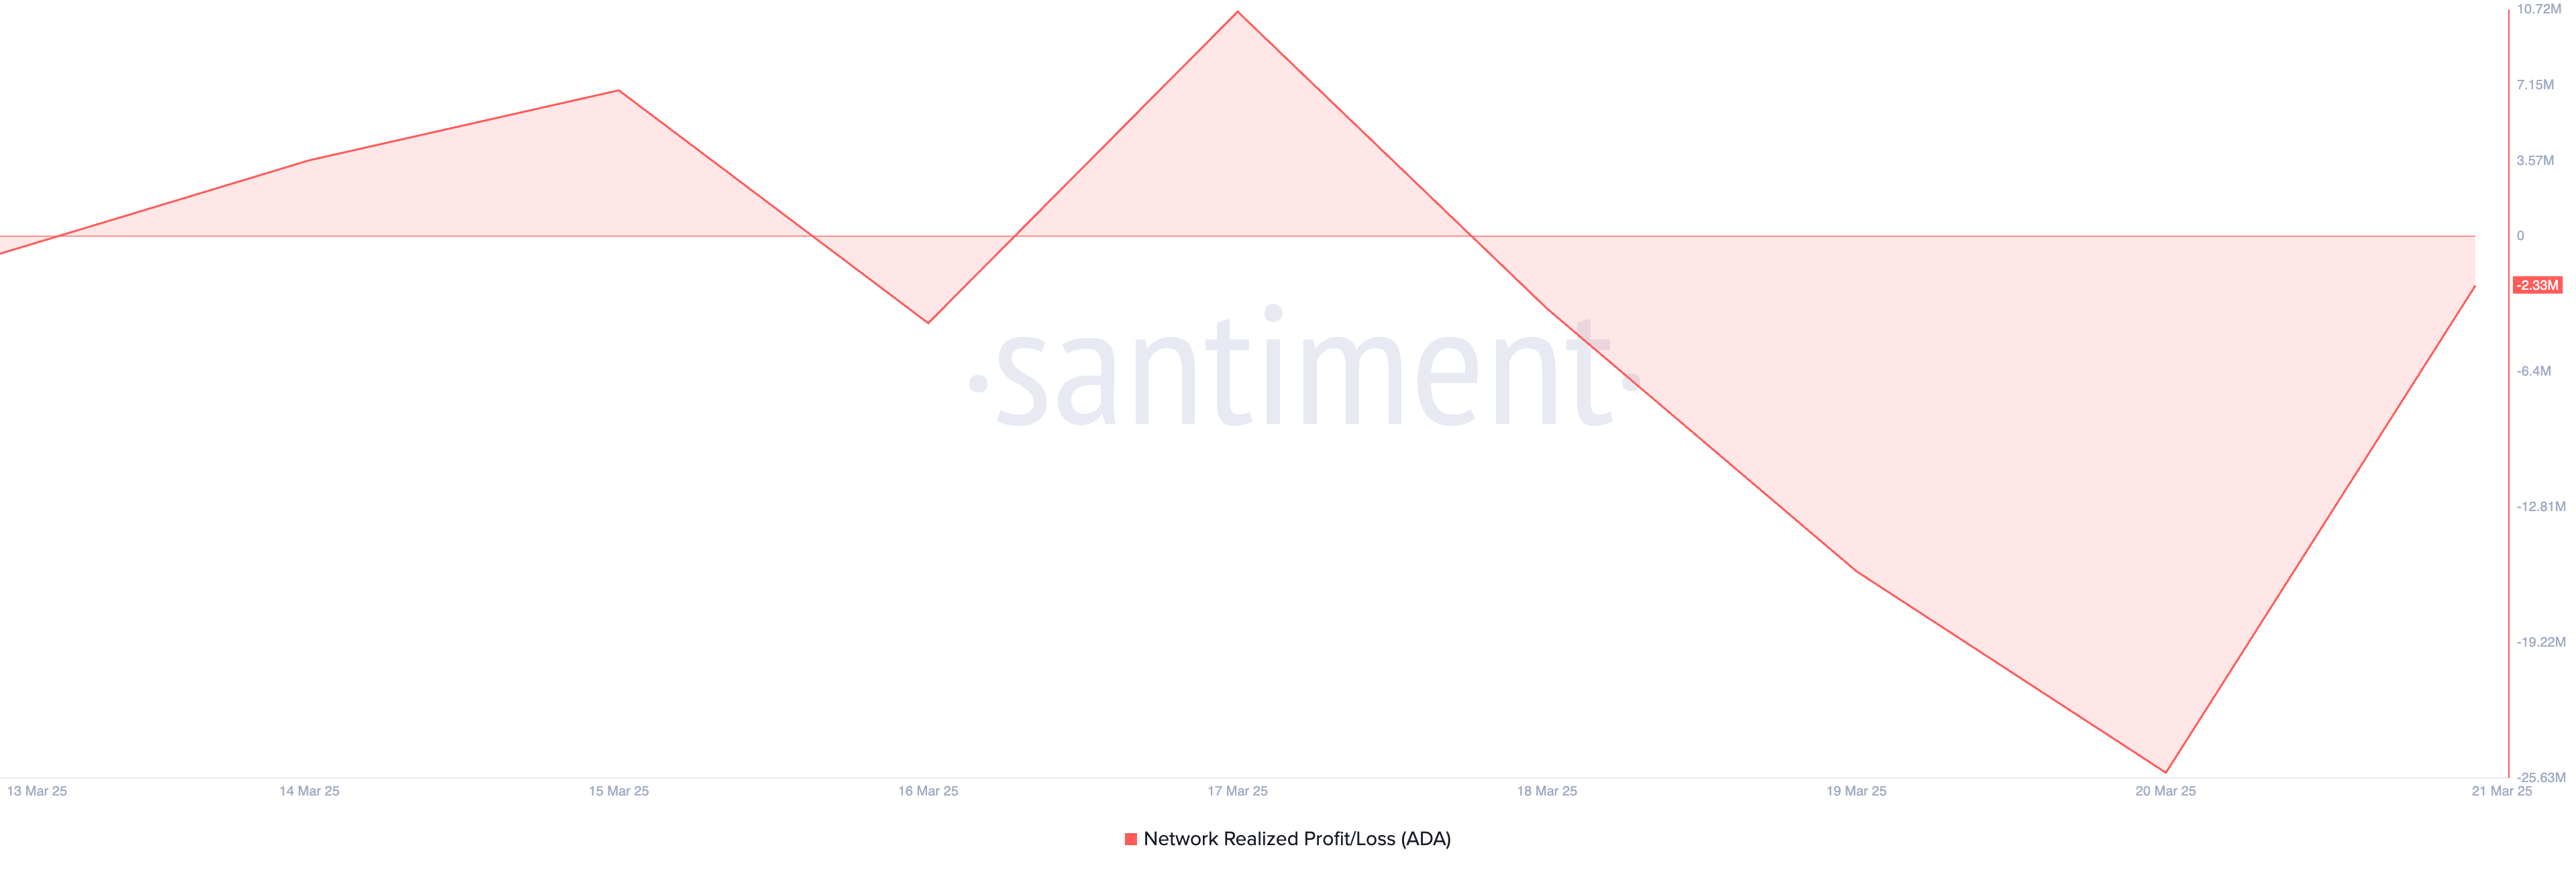
This metric measures the total profit or loss realized by investors when they move their coins on-chain, indicating overall market sentiment. When NPL is negative, more investors are at a loss, reducing the incentive to sell.
This would help reduce selling pressure in the ADA market and increase the likelihood of a potential rebound as more investors hold onto their assets instead of realizing losses.
ADA’s Next Move: Break Above $0.75 or Drop to $0.65?
At press time, ADA trades at $0.71. The horizontal trend of its Relative Strength Index (RSI) on the daily chart confirms the coin’s sideways movements.
The RSI indicator measures an asset’s oversold and overbought market conditions. When it is flat, as with ADA, it indicates a balance between buying and selling pressure, meaning there is no clear momentum in either direction. This suggests market consolidation, where the asset trades within a range without strong bullish or bearish dominance.
However, with the steady uptick in ADA accumulation, a break above the resistance at $0.75 could be on the horizon. If successful, ADA could rally toward $0.77.
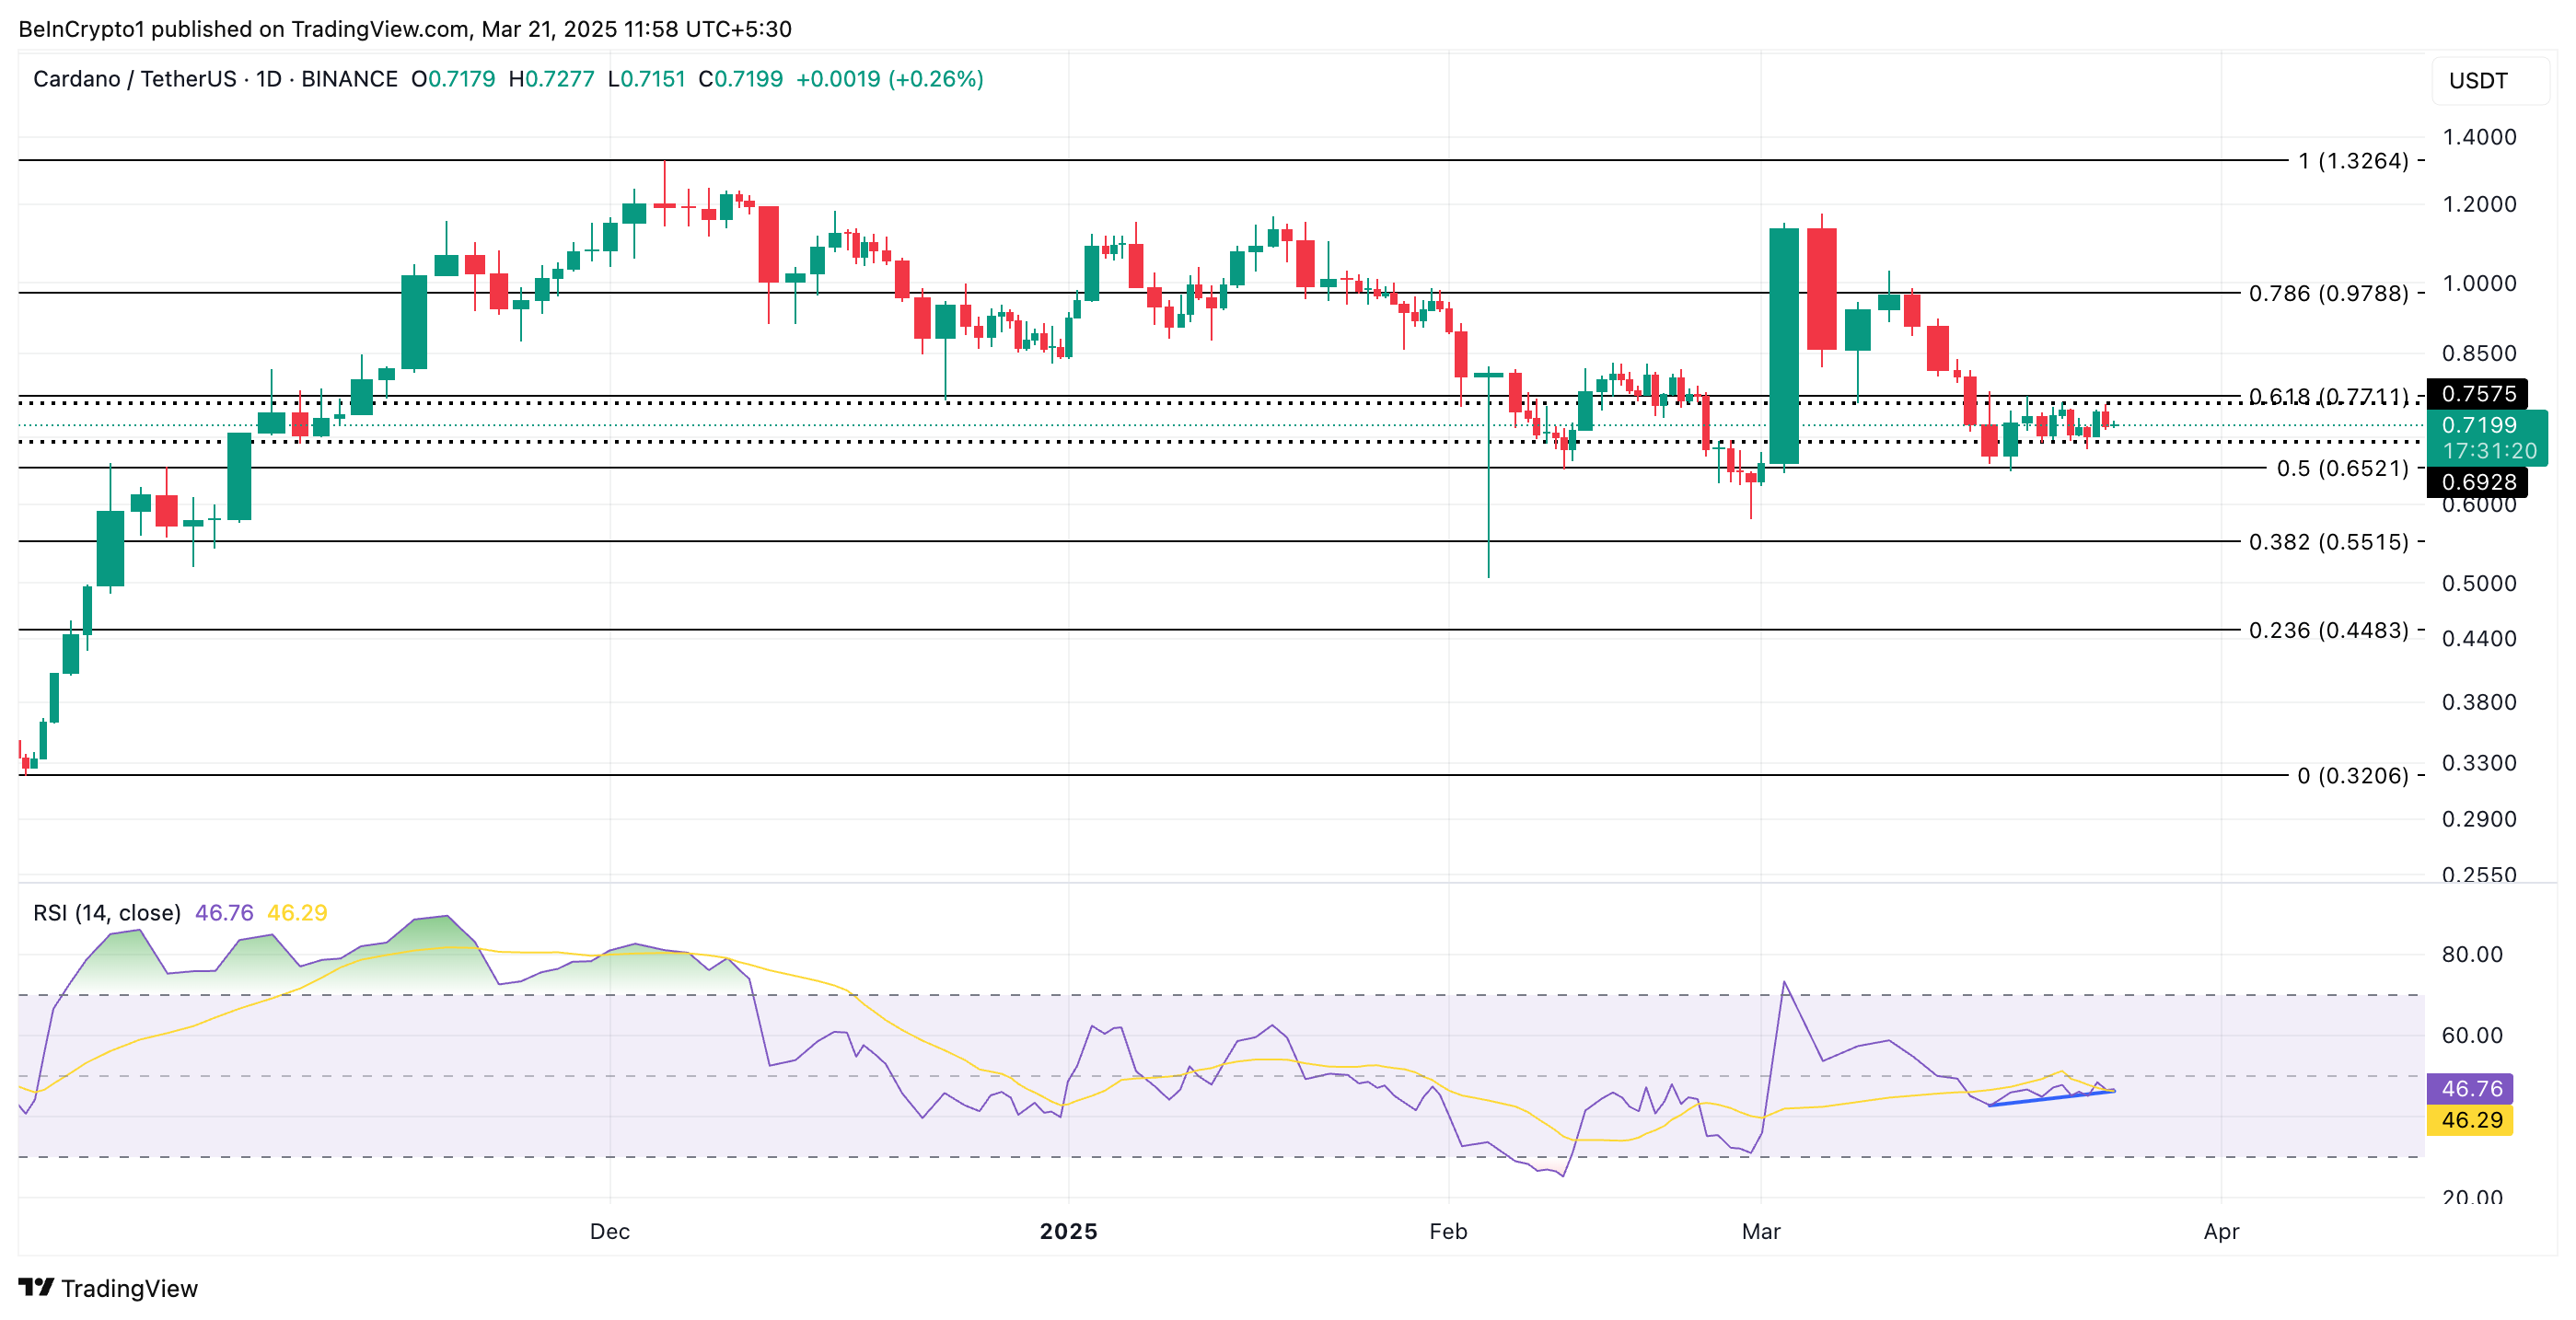
On the other hand, a breakdown below the $0.69 support could trigger a decline to $0.65.
Disclaimer
In line with the Trust Project guidelines, this price analysis article is for informational purposes only and should not be considered financial or investment advice. BeInCrypto is committed to accurate, unbiased reporting, but market conditions are subject to change without notice. Always conduct your own research and consult with a professional before making any financial decisions. Please note that our Terms and Conditions, Privacy Policy, and Disclaimers have been updated.