Cardano Traders on Edge as Technical Signals Clash


Cardano has been trading below $1 for a month, struggling to regain the momentum it had at the end of 2024. While ADA has shown signs of recovery, technical indicators remain mixed. BBTrend turned positive again but is still far from its previous highs.
The Ichimoku Cloud suggests an indecisive phase, where ADA is attempting to stabilize but lacks strong bullish confirmation. With key resistance at $0.83 and support at $0.65, its next move will be crucial in determining whether it can break out of its range or face further downside toward $0.50.
ADA BBTrend Is Back to Positive After Briefly Touching Negative Levels
Cardano’s BBTrend is currently at 1.12, recovering from a brief dip into negative territory at -0.77 yesterday. Between February 13 and February 18, BBTrend remained positive, peaking at 12.3 on February 14, indicating strong bullish momentum during that period.
However, the recent decline and subsequent rebound suggest that ADA has been experiencing increased volatility, with price action fluctuating between bullish and bearish phases.
While BBTrend is now back in positive territory, it remains far below its recent peak, signaling that ADA’s momentum has weakened but has not entirely shifted into a downtrend.
BBTrend, or Bollinger Band Trend, is an indicator that helps measure trend strength based on Bollinger Bands. It fluctuates between positive and negative values, with positive readings suggesting an uptrend and negative readings indicating bearish conditions.
ADA’s BBTrend at 1.12 suggests that the asset is holding onto a weak bullish structure but is lacking strong upside momentum. If BBTrend continues rising, it could confirm renewed buying pressure, supporting a sustained uptrend.
However, if it turns negative again, it would indicate that ADA is struggling to maintain upward momentum, increasing the risk of further consolidation or even a new downtrend.
Ichimoku Cloud Shows a Mixed Scenario for Cardano
The Ichimoku Cloud chart for Cardano currently shows a mixed setup. Price is trading inside the green cloud, indicating a state of indecision.
The green cloud (Kumo) suggests that ADA is attempting to stabilize, but with the orange Senkou Span B remaining flat, the market lacks strong momentum in either direction.
The purple Tenkan-sen (conversion line) is positioned just below the orange Kijun-sen (baseline line), showing that short-term momentum remains weak. ADA’s ability to remain inside the cloud suggests that it is neither in a confirmed uptrend nor a downtrend, making the next breakout crucial for defining its direction.
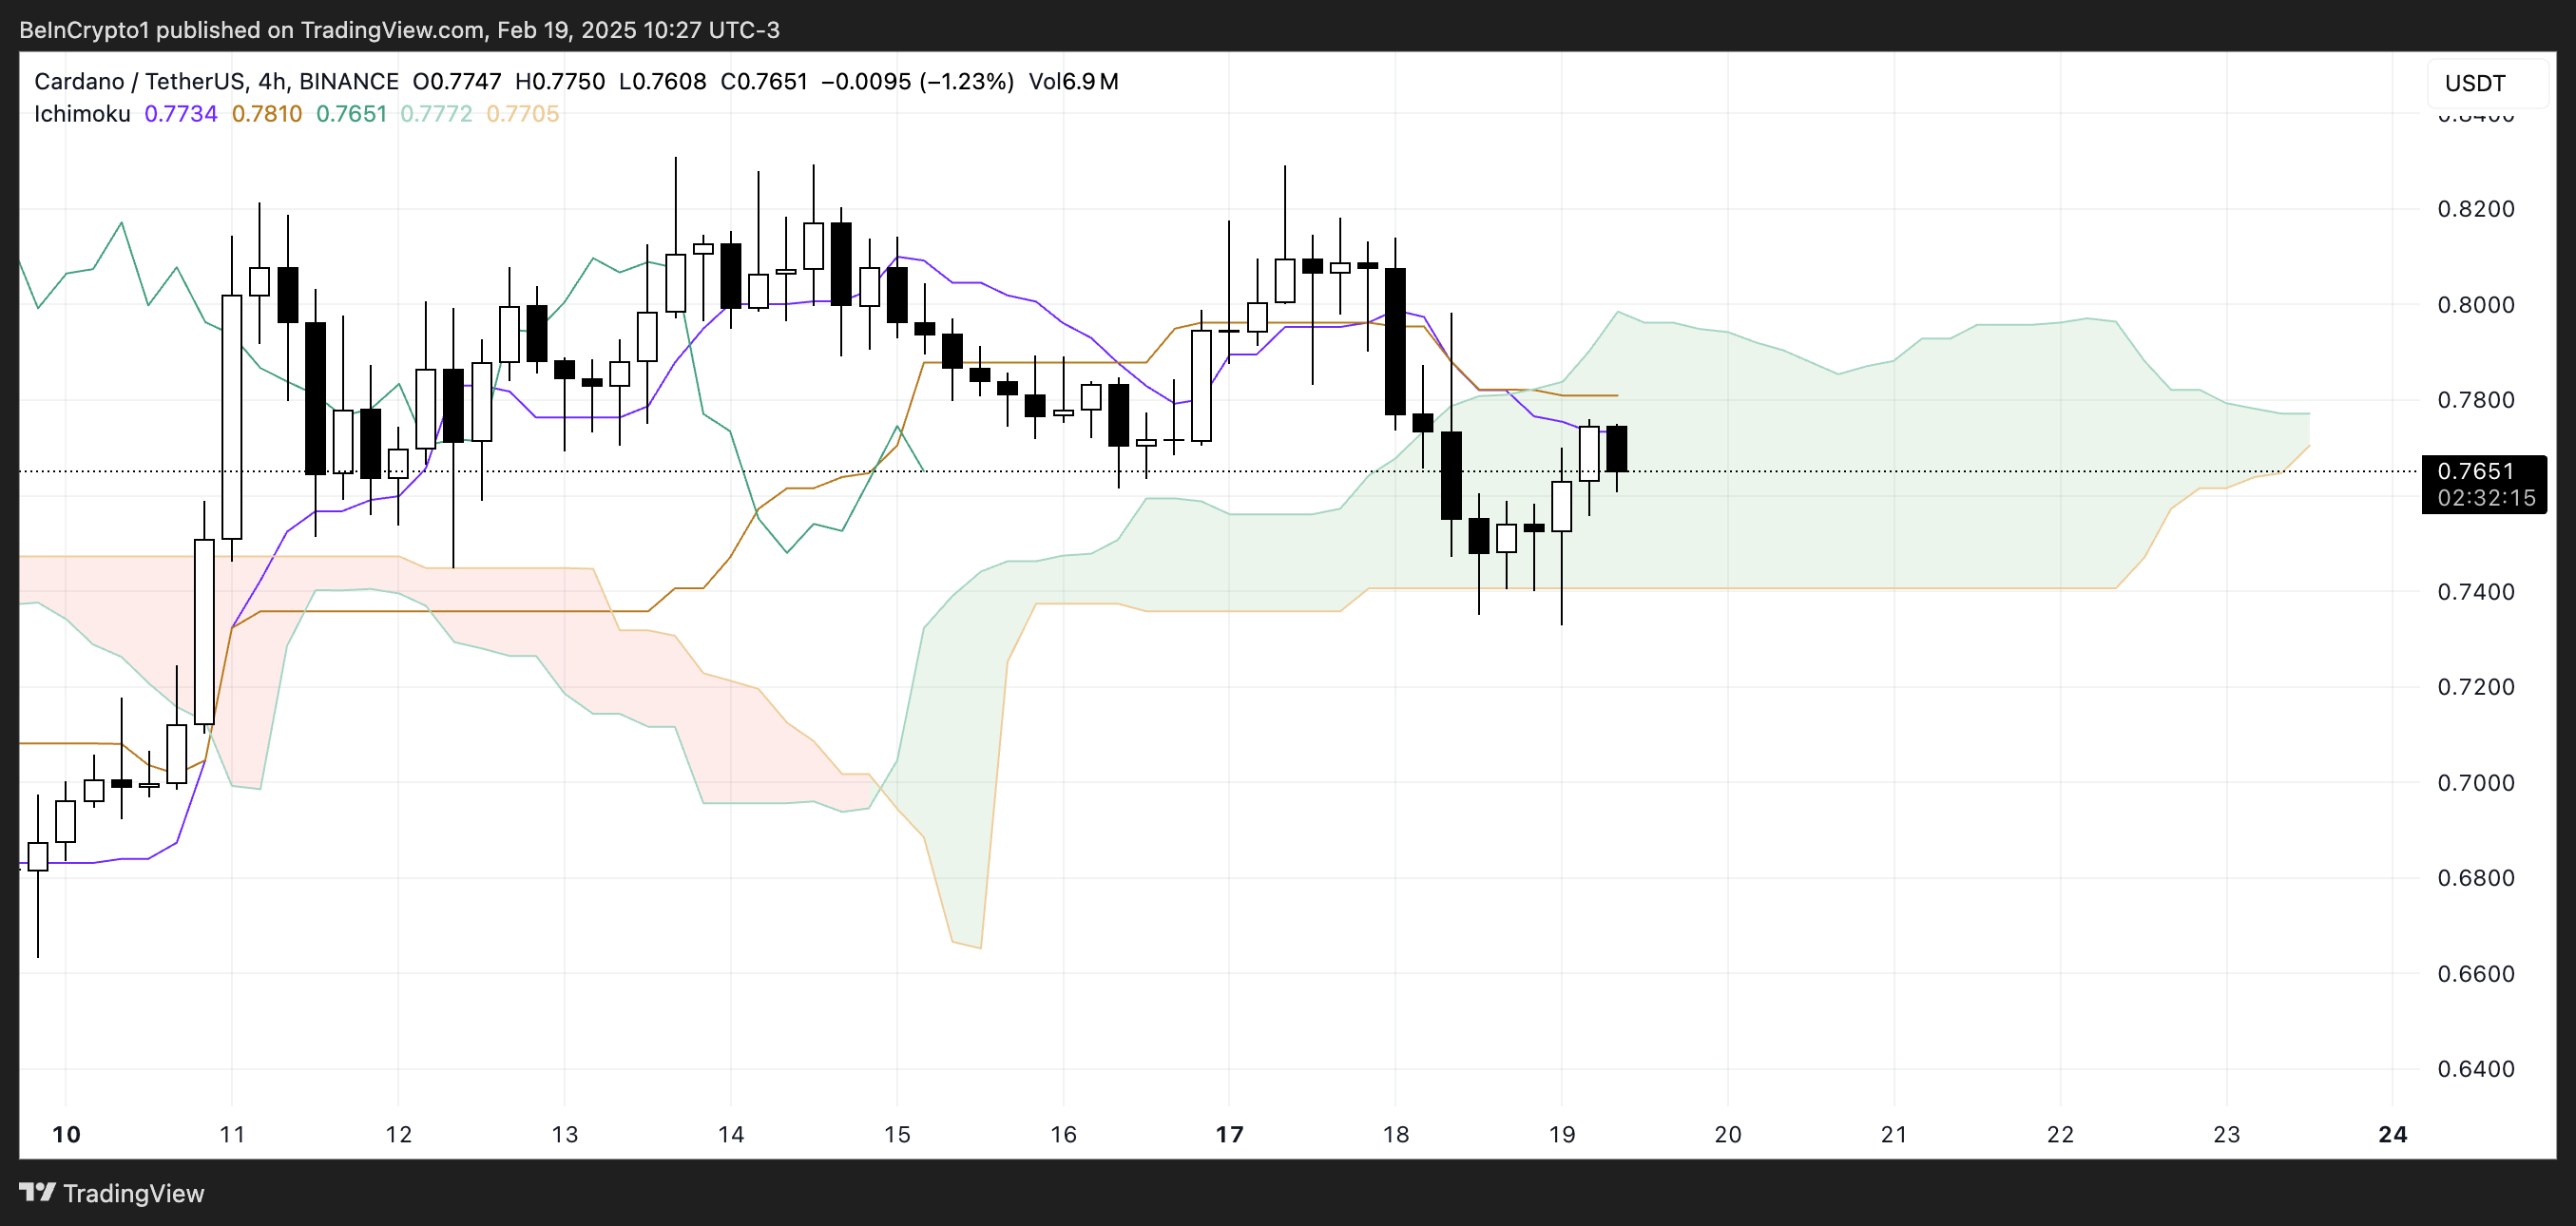
The green Chikou Span (lagging line) is slightly above some past price action, which hints at a potential shift toward bullish momentum, but confirmation is still needed.
If the price of ADA manages to break above the cloud and establish itself above the orange Kijun-sen, it could signal a trend reversal and a move into bullish territory.
However, if the price fails to hold within the cloud and falls below it, bearish pressure could take over again, leading to further downside. The current Ichimoku setup suggests ADA is at a key inflection point, with its next move likely determining the broader trend for the coming days.
Cardano Can Test $0.83 Soon
Cardano is currently trading within a defined range, with resistance at $0.83 and support at $0.65.
The short-term moving averages are clustered closely together but remain below the long-term ones, indicating that while there is some consolidation, the overall trend is still lacking upward momentum. If ADA manages to ignite a sustained uptrend, it could push upward to test the $0.83 resistance level.
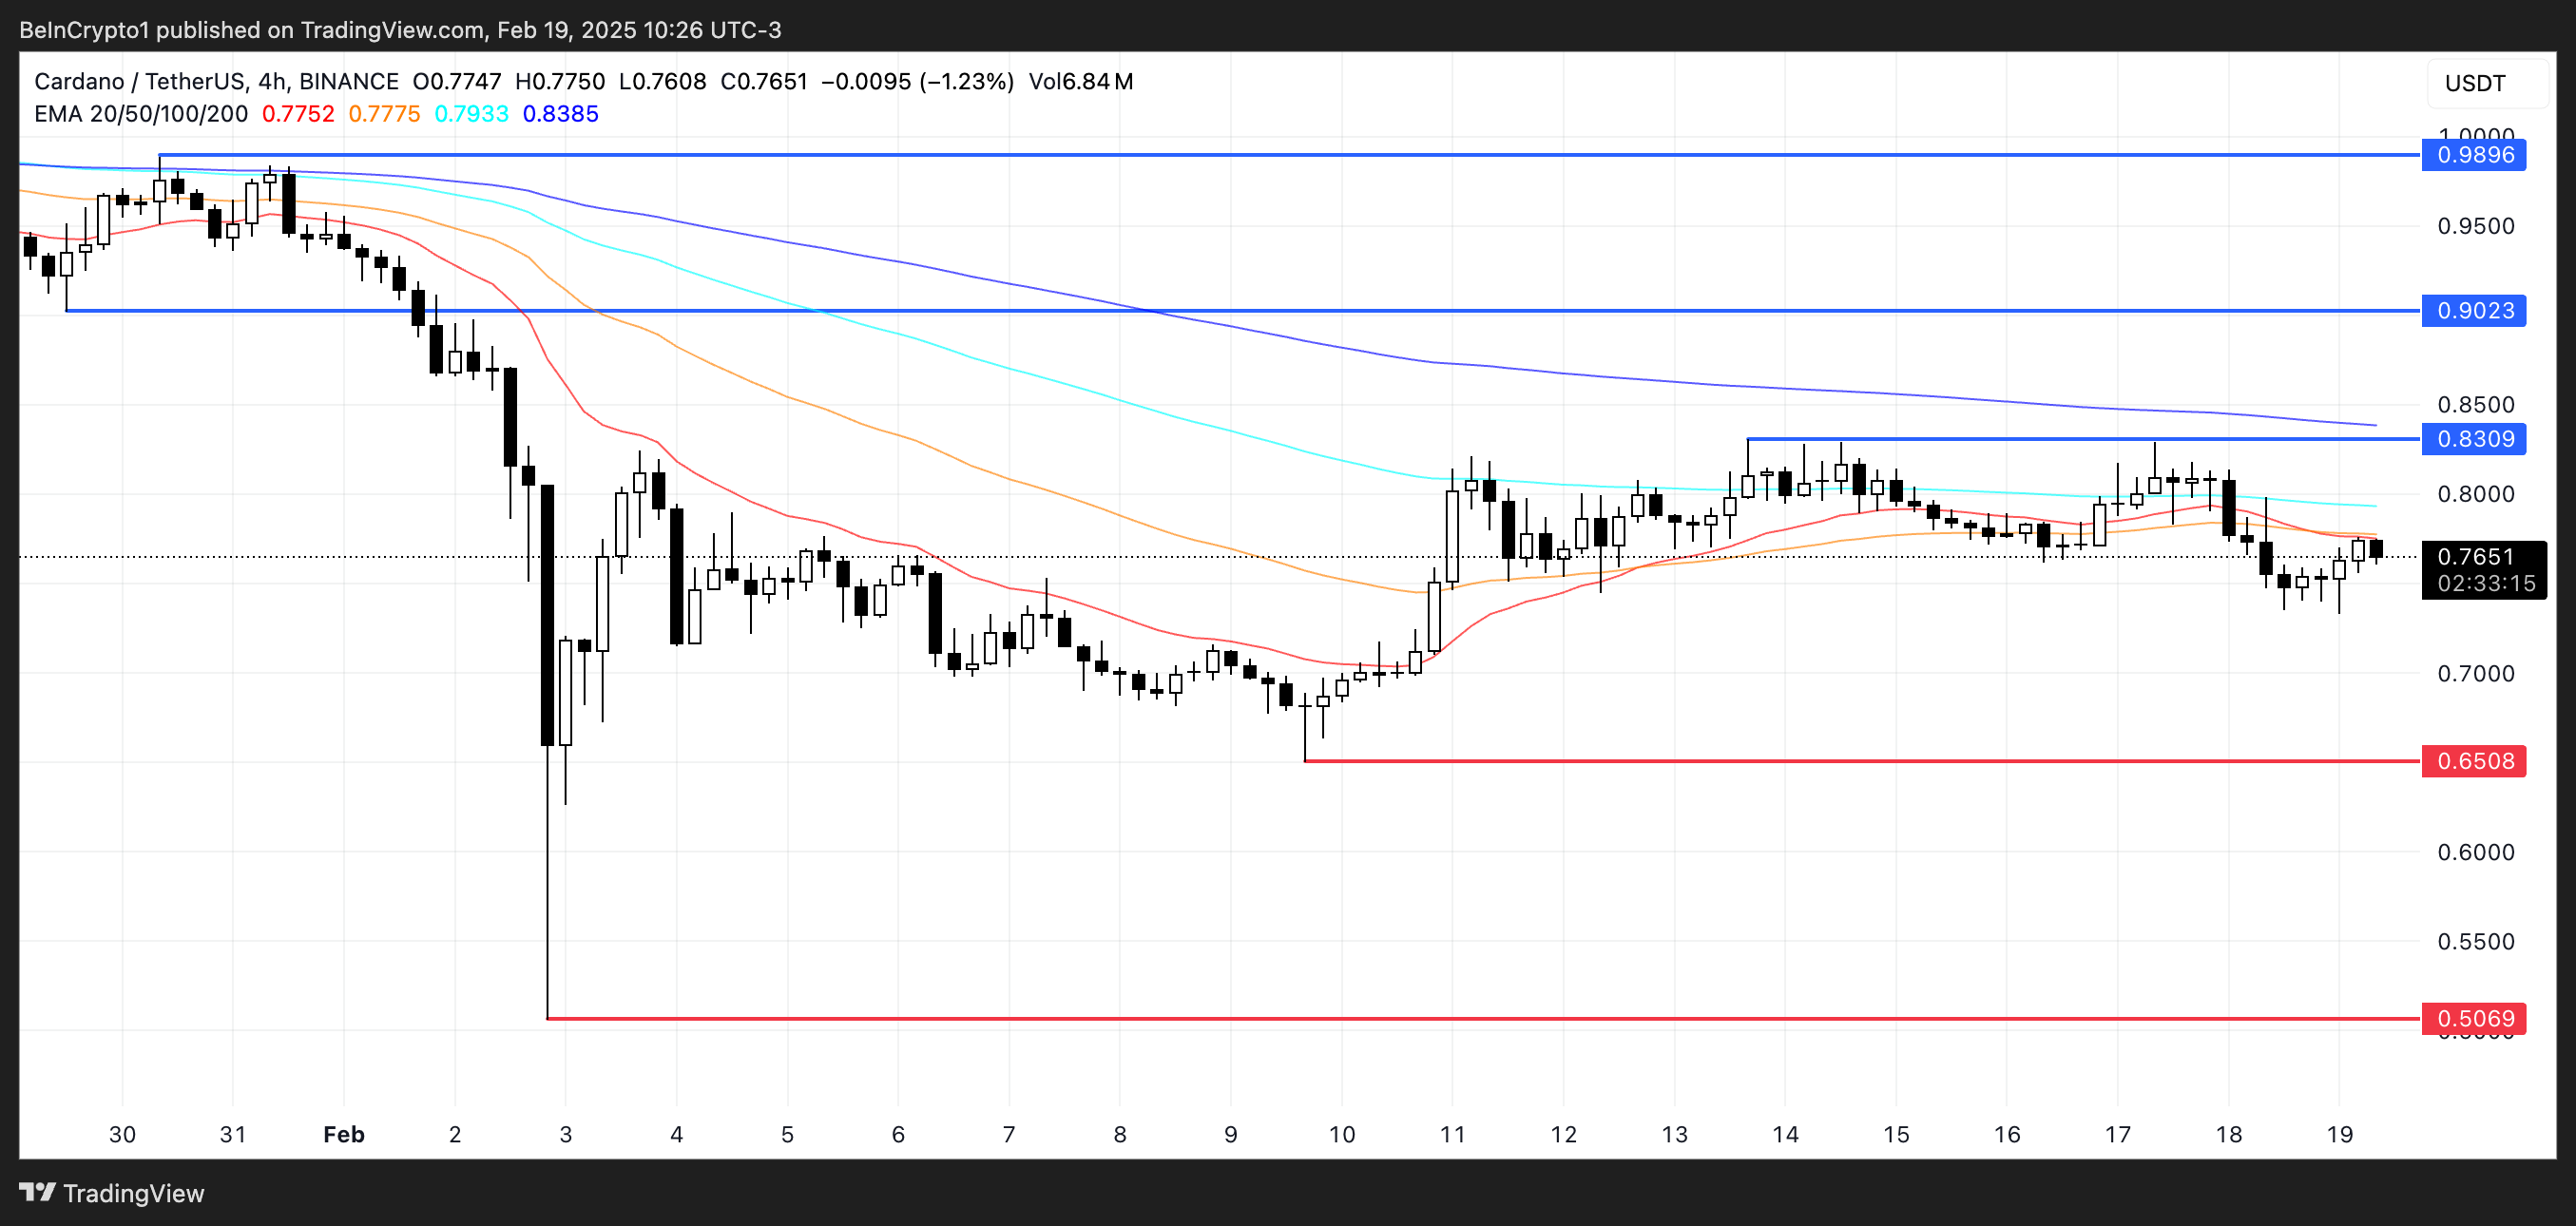
A successful break above this barrier might pave the way for further gains, potentially reaching $0.9 and then climbing as high as $0.98, marking its highest level since the end of January.
Conversely, if the current momentum fails to materialize into a strong uptrend and bearish forces strengthen, ADA might lose its support at $0.65.
A breakdown at this key level could expose ADA to further declines, with the price possibly falling to around $0.5, which represents a potential 34% correction from current levels.
Disclaimer
In line with the Trust Project guidelines, this price analysis article is for informational purposes only and should not be considered financial or investment advice. BeInCrypto is committed to accurate, unbiased reporting, but market conditions are subject to change without notice. Always conduct your own research and consult with a professional before making any financial decisions. Please note that our Terms and Conditions, Privacy Policy, and Disclaimers have been updated.