Ethena (ENA) Price Stalls, Setting the Stage for a Breakout

Ethena (ENA) price has experienced significant volatility, rising 63% over the last 30 days but declining 11% in the past week. Despite the recent pullback, ENA maintains a strong market presence with a current market cap of $3 billion.
Technical indicators, including RSI and DMI, suggest the token is in a period of consolidation, lacking strong directional momentum. Traders are closely watching critical support and resistance levels to gauge ENA’s next potential move in the short term.
ENA RSI Is Currently Neutral
The ENA Relative Strength Index (RSI) currently sits at 47.3, reflecting a neutral state since December 21. RSI values in this range suggest that neither buyers nor sellers are in clear control of the market, with the token showing balanced trading momentum.
This neutral position indicates that recent price movements lack significant directional strength, providing little evidence of either an overbought or oversold condition.
RSI, a widely used momentum indicator, measures the speed and change of price movements on a scale of 0 to 100. Typically, an RSI above 70 signals that an asset may be overbought and could face a potential price correction, while an RSI below 30 indicates an oversold condition, suggesting the possibility of a rebound.
With Ethena RSI at 47.3, the token remains in a consolidation phase, neither signaling a strong bullish push nor warning of imminent bearish activity. In the short term, this level may imply that Ethena price could continue trading sideways, though any break above or below key RSI thresholds might prompt a shift in momentum.
ENA DMI Shows an Undefined Trend
The ENA Directional Movement Index (DMI) chart indicates that its Average Directional Index (ADX) is currently at 10.7, down from 20 as of December 21. A declining ADX suggests a weakening trend, as values below 20 typically indicate a lack of significant directional strength in the market.
This drop reinforces the view that ENA is not experiencing a strong or sustained bullish or bearish trend, signaling a period of market indecision or consolidation.

ADX, a key component of the DMI, measures the strength of a trend without indicating its direction. Values above 25 point to a strong trend, and those below 20 signal a weak or absent trend. The DMI also incorporates two directional lines: the positive directional indicator (D+, currently at 22) and the negative directional indicator (D-, currently at 17.97).
In ENA’s case, D+ being higher than D- suggests slight bullish dominance, but the low ADX value at 10.7 implies that the trend lacks meaningful strength. This combination suggests that ENA short-term price movement is likely to remain subdued, with no clear directional momentum, potentially resulting in range-bound trading. A rise in ADX could signal a shift toward stronger trends in either direction.
ENA Price Prediction: Can ENA Fall Below $0.80 Soon?
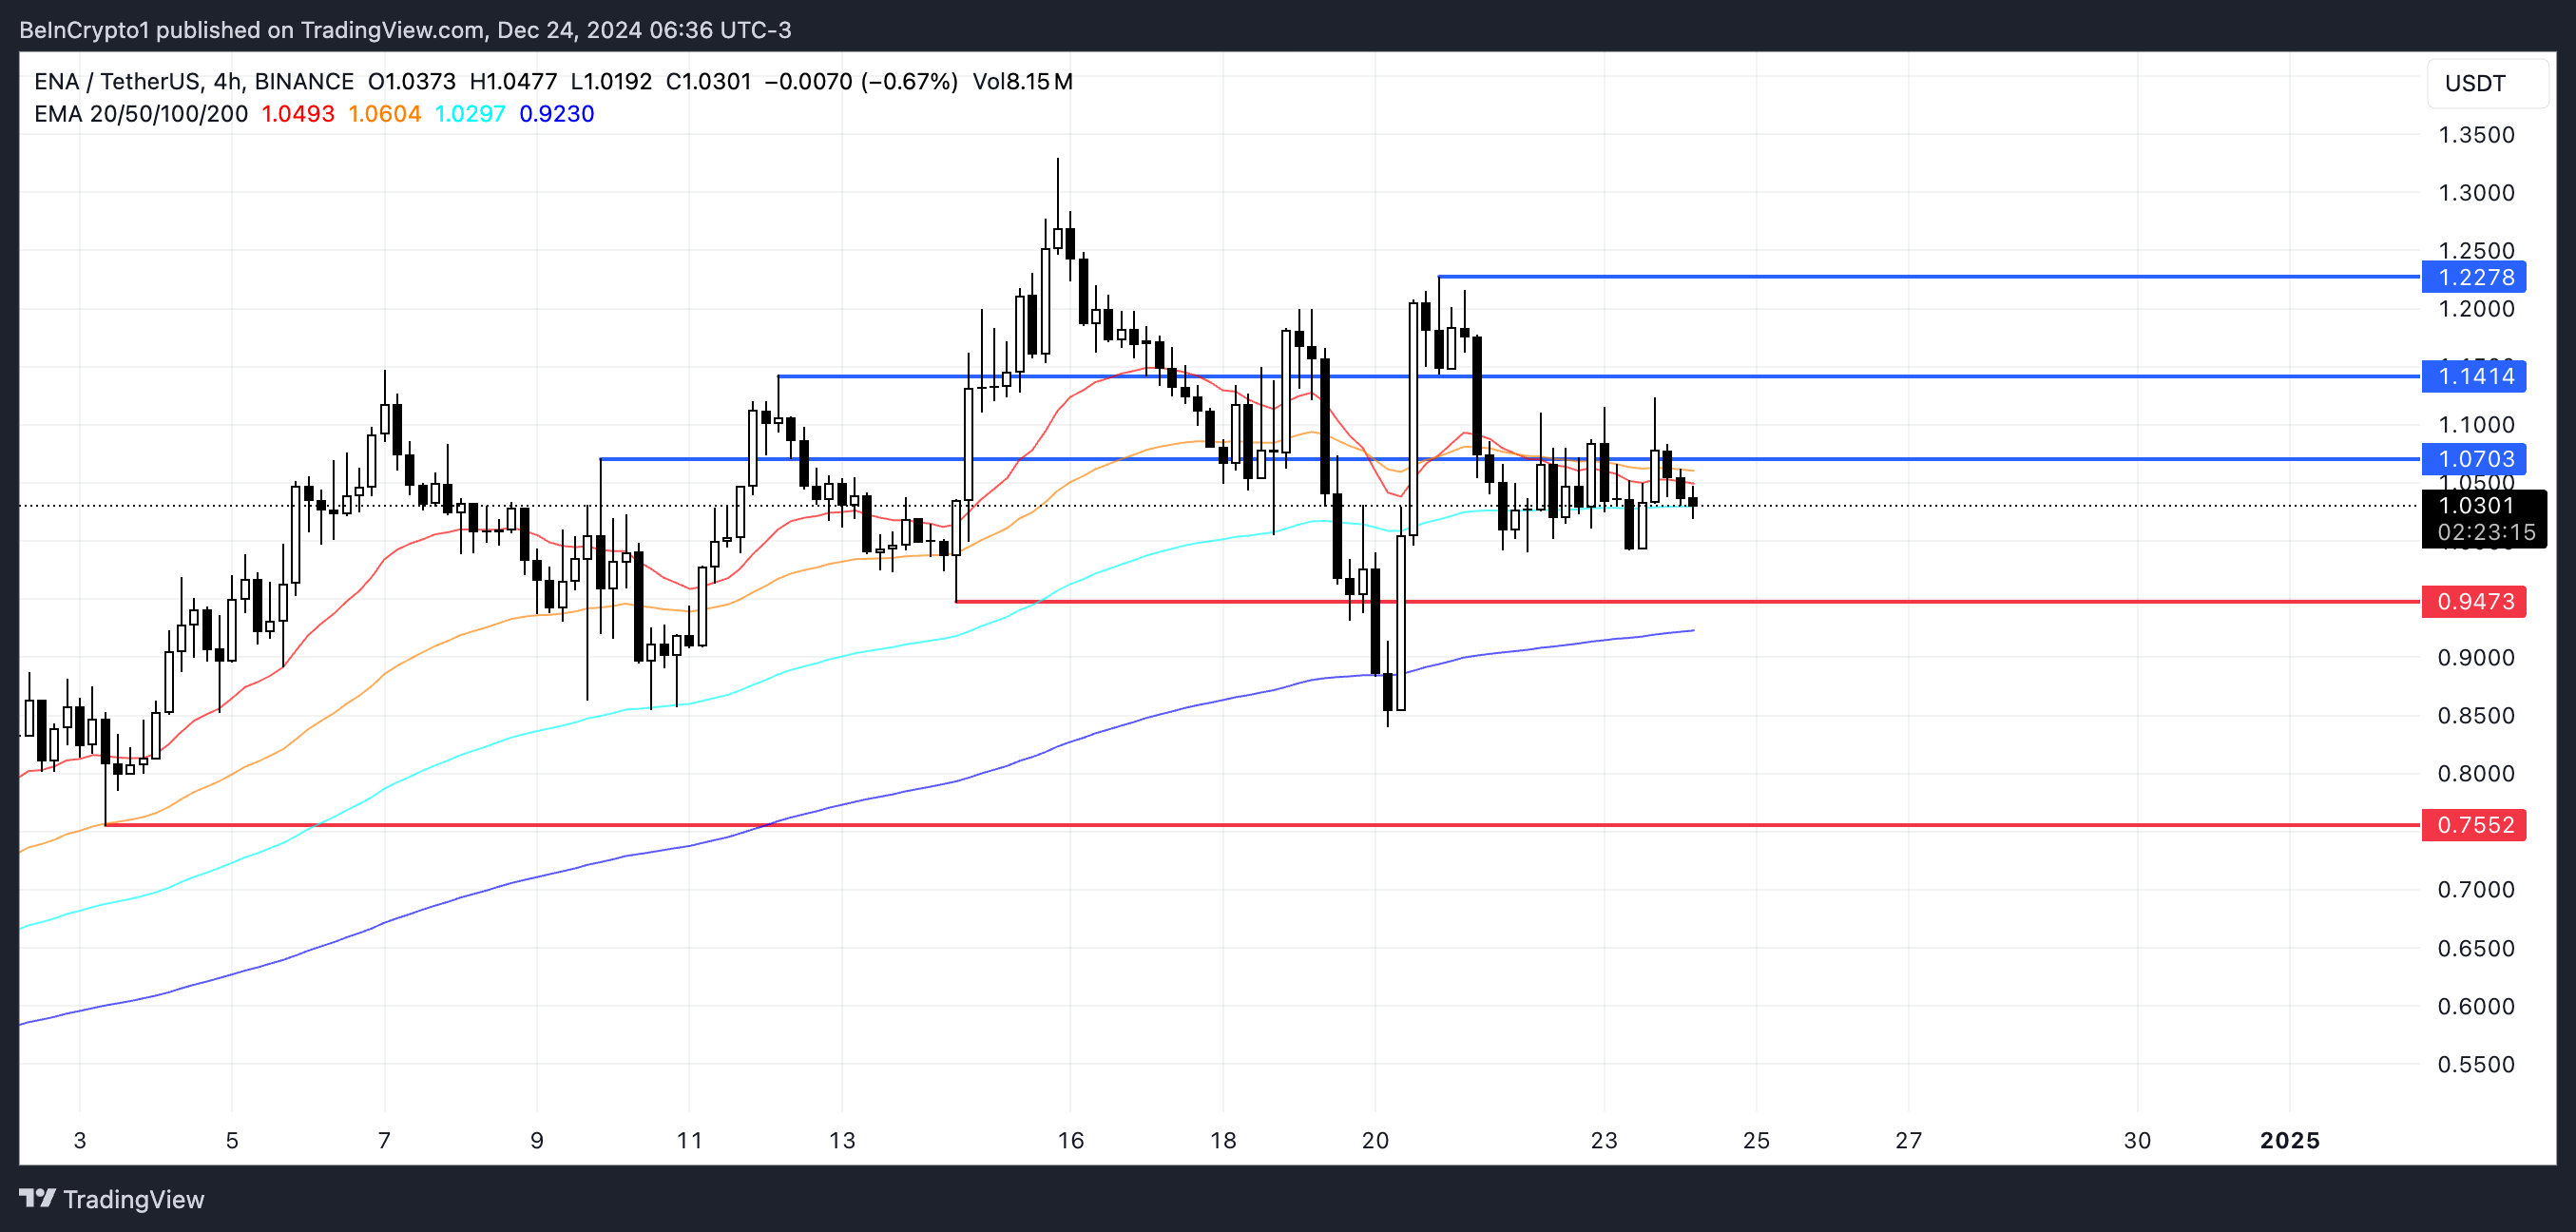
Ethena is currently trading within a range, with resistance at $1.07 and support at $0.94 defining its immediate price boundaries. A break above the $1.07 resistance could pave the way for ENA price to test the next resistance at $1.14, with further upward momentum potentially driving the price to $1.22.
This scenario represents an 18% potential upside from current levels, suggesting a favorable risk-reward ratio for bullish traders if momentum picks up.

Conversely, if the $0.94 support fails to hold, ENA price could face a sharp decline, with its price potentially dropping to $0.75—a 27% downside risk. This shows the significance of the current range, as a breach of either level would likely dictate ENA’s short-term price trajectory.
While a breakout above $1.07 signals bullish continuation, a breakdown below $0.94 could attract selling pressure, making these levels crucial for traders to monitor closely.
Disclaimer
In line with the Trust Project guidelines, this price analysis article is for informational purposes only and should not be considered financial or investment advice. BeInCrypto is committed to accurate, unbiased reporting, but market conditions are subject to change without notice. Always conduct your own research and consult with a professional before making any financial decisions. Please note that our Terms and Conditions, Privacy Policy, and Disclaimers have been updated.


