Fresh Capital Keeps Pouring Into Bitcoin – Matching 2021 Bull Market Inflows


Bitcoin has seen a modest 5% retracement over the past few days after reaching a new all-time high of $112,000. Despite the pullback, the market remains firmly in bullish territory, with BTC holding above key support levels. Bulls appear in control, but the recent pause has introduced a wave of speculation as investors assess whether this is a healthy correction or a signal of deeper consolidation ahead.
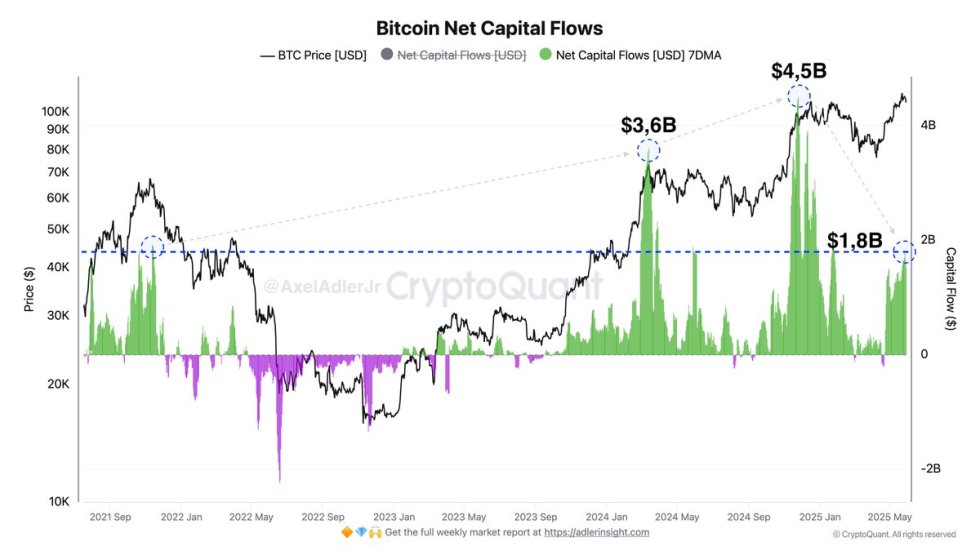
Amid the uncertainty, on-chain data paints a strong picture of underlying demand. Top analyst Axel Adler shared insights revealing that capital inflows into Bitcoin are now approaching peak bull market levels. According to Adler, an average of $1.8 billion in fresh capital is entering the Bitcoin market each day—matching the levels last seen in November 2021, when BTC was trading around $64K.
This sustained inflow of capital, even after Bitcoin hit a new ATH, highlights growing investor confidence and appetite for exposure to BTC. While short-term volatility remains, the broader trend signals a market that is still heating up. If demand holds steady or increases further, Bitcoin could soon resume its climb, with the next breakout potentially pushing beyond $115,000.
Bitcoin Demand Remains Strong Despite Pullback
Bitcoin is currently trading around $105,000 after a brief retracement from its $112,000 all-time high. While some investors interpret the pullback as a potential warning signal, many analysts argue that BTC is simply cooling off before its next leg higher. The coming days will be pivotal, as bulls must defend current levels and reclaim higher ground to confirm a continuation of the broader uptrend.
Adding to the complexity is the backdrop of global macroeconomic uncertainty. Rising U.S. Treasury yields continue to signal systemic financial stress, while geopolitical tensions and policy shifts, including recent U.S. tariff rulings, stir volatility across global markets. Yet, despite this turbulence, Bitcoin appears to thrive. Investors increasingly view BTC as a hedge against both inflation and monetary instability.
On-chain data supports this sentiment. Adler highlights that demand for Bitcoin is now approaching levels seen during the peak of the previous bull cycle. CryptoQuant data reveals that an average of $1.8 billion in new capital flows into Bitcoin daily, matching the intensity of inflows seen around the $64,000 mark in November 2021. Notably, the largest inflows of this current cycle were recorded at $73K and $92K, peaking at $3.6 billion and $4.5 billion, respectively.
This sustained appetite for BTC—even after reaching new highs—signals confidence among institutional and retail investors alike. The market isn’t cooling off due to a lack of interest; instead, it’s regrouping. If demand remains at these levels or accelerates, Bitcoin could be gearing up for another explosive move, potentially targeting the $120,000 range in the near term.
BTC Weekly Chart Shows Healthy Pullback at Key Resistance
The weekly chart for Bitcoin shows that BTC is undergoing a healthy consolidation phase just below the $112,000 all-time high. After a strong push that brought price action to $110,789, Bitcoin retraced to $105,466, marking a 5% correction from local highs. Despite the retracement, the structure remains decisively bullish. BTC continues to trade well above the 34-week EMA ($89,020), and the price has yet to break below the critical $103,600–$105,000 support zone.
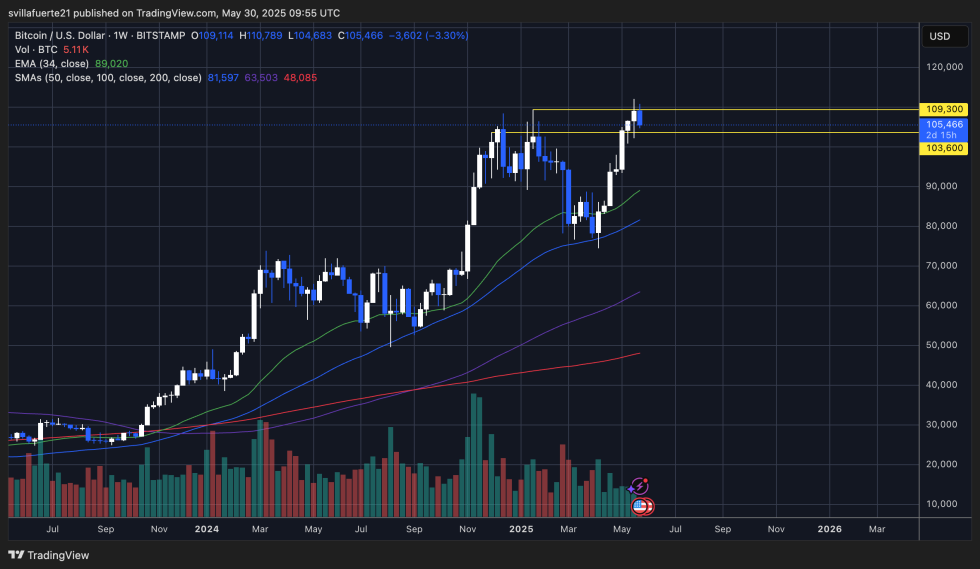
Volume has remained relatively stable, indicating there’s no panic selling—just a pause after a strong move. The resistance at $109,300 is acting as a magnet for price action, and a weekly close above this level could confirm a continuation toward $120,000.
On-chain metrics and price structure suggest buyers remain in control, but bulls must reclaim $109K in the coming sessions to regain momentum. Until then, BTC is likely to chop within the $103K–$110K range. If it breaks below $103,600, it could test deeper support near the 34 EMA. Overall, this chart reflects a classic bullish pause within a strong uptrend, setting the stage for a potential breakout if macro conditions align and demand remains steady.
Featured image from Dall-E, chart from TradingView

Editorial Process for bitcoinist is centered on delivering thoroughly researched, accurate, and unbiased content. We uphold strict sourcing standards, and each page undergoes diligent review by our team of top technology experts and seasoned editors. This process ensures the integrity, relevance, and value of our content for our readers.