Stellar (XLM) Price Jumps as Buyers Flood the Market


Stellar (XLM) has been up almost 19% over the last seven days, and its market cap is now close to $9 billion. The RSI has surged above 70, while the ADX shows rising trend strength, and the EMA lines confirm bullish momentum.
XLM is holding an uptrend and pushing toward key resistance around $0.30. However, if support levels fail, signs of overheating could lead to short-term pullbacks.
Is Stellar Overheating? RSI Hits 71.5
Stellar is currently showing strong bullish momentum. Its Relative Strength Index (RSI) climbed to 71.5, significantly from 55.2 just three days ago.
This rapid increase highlights a surge in buying activity, reflecting growing investor confidence in XLM’s short-term price prospects. The sharp move also suggests that Stellar has quickly transitioned from a neutral to a more aggressively bullish setup, capturing attention among traders who closely monitor momentum indicators for entry and exit signals.
Such a fast rise in RSI often indicates intense demand, but it can also signal that the asset is approaching stretched conditions, which may increase volatility.
The RSI, or Relative Strength Index, is a technical indicator used to assess the strength and speed of an asset’s recent price movements. It operates on a scale from 0 to 100, where readings above 70 generally suggest an asset is overbought, and readings below 30 indicate oversold conditions.
When the RSI crosses above 70, it often warns that the asset could be due for a pause, consolidation, or minor correction as buying momentum overheats.
With Stellar’s RSI now at 71.5, XLM has officially entered overbought territory. This could mean that while bullish sentiment remains dominant, the price is increasingly vulnerable to pullbacks if momentum slows or traders begin locking in profits after the recent surge.
XLM Trend Momentum Builds as Buying Pressure Dominates
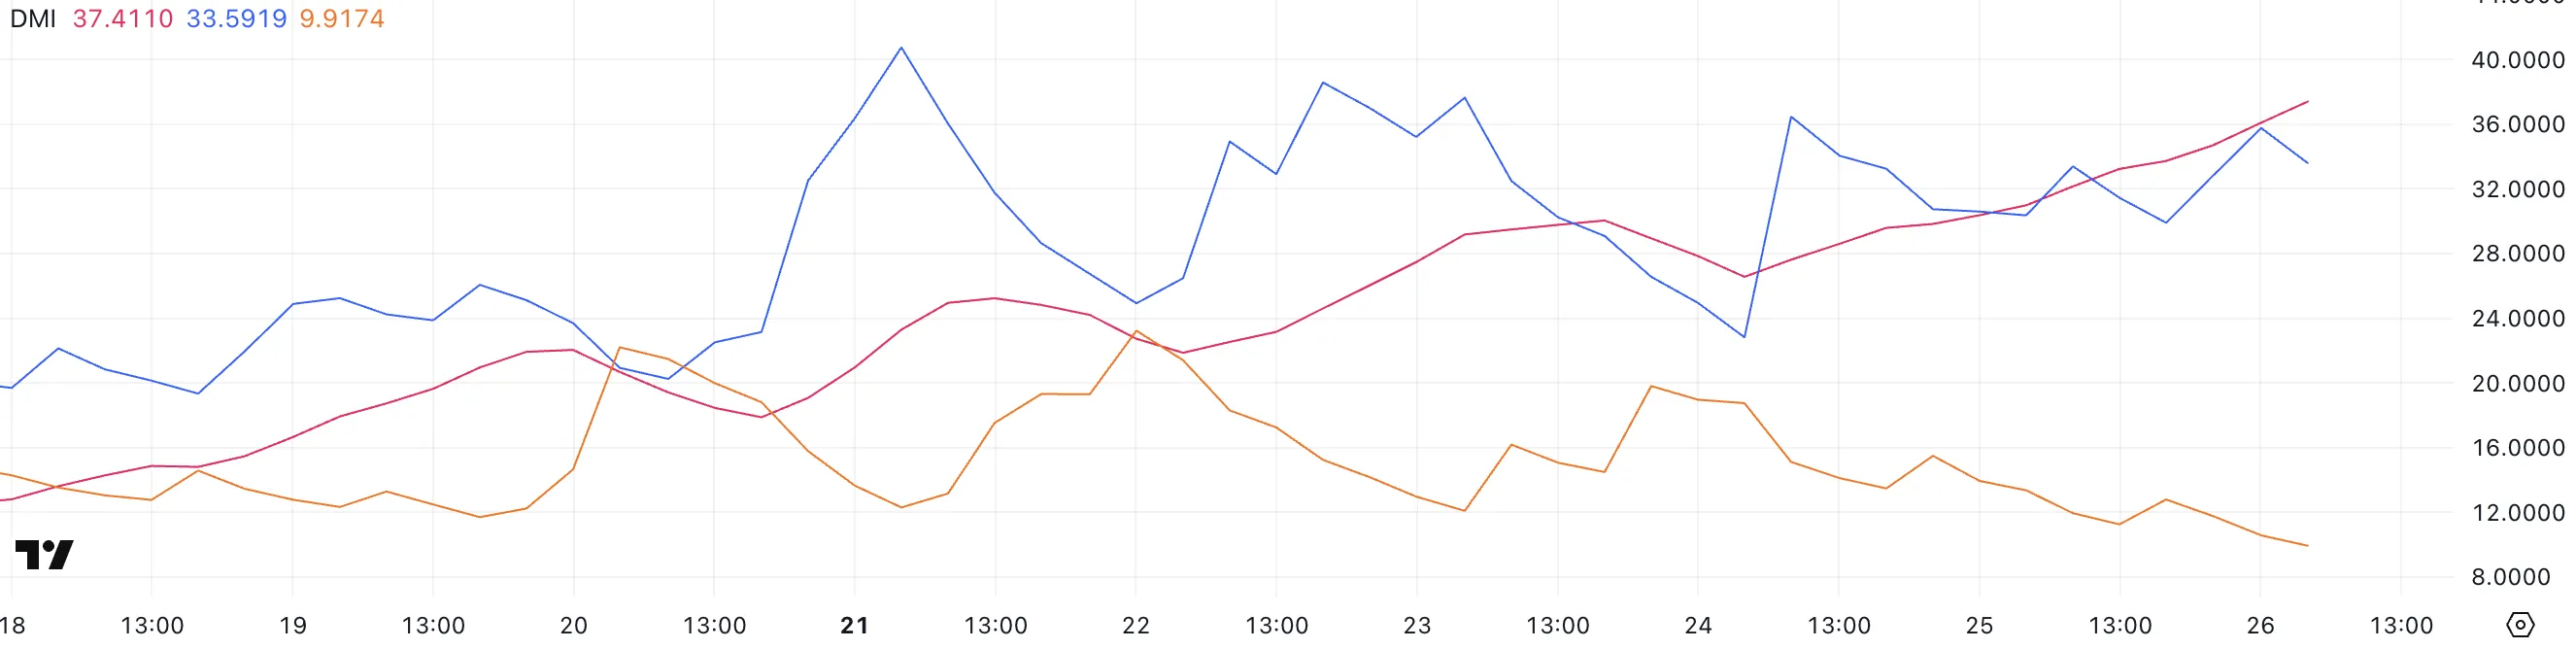
The Stellar Directional Movement Index (DMI) chart signals strengthening trend momentum. Its Average Directional Index (ADX) is currently at 37.41, up from 26.56 just two days ago.
This sharp increase in ADX suggests that the trend is gaining strength, confirming that market participants are firmly committed to the prevailing direction.
An ADX above 25 generally indicates the presence of a meaningful trend, and with XLM’s ADX now approaching 40, the uptrend is well-established and becoming increasingly powerful, attracting more attention from momentum traders and technical analysts.
The ADX, or Average Directional Index, measures the strength of a trend. It does not indicate the direction. It moves between 0 and 100. Readings below 20 show a weak or non-existent trend. Readings above 25 suggest a strong and sustainable trend is underway.
Along with the ADX, the DMI tracks two other important lines. The Positive Directional Indicator (+DI) measures upward pressure, while the negative directional indicator (-DI) measures downward pressure.
XLM’s +DI is now at 33.59. It was at 22.81 two days ago but is slightly down from a recent peak of 36.47. This shows some short-term volatility, even with strong overall buying pressure.
Meanwhile, the -DI has dropped sharply to 9.91 from 19.8 three days ago. This signals that selling pressure has weakened considerably.
Taken together, these movements confirm that XLM remains firmly in an uptrend. However, small fluctuations in +DI suggest that while bulls are still in control, the pace of buying could face brief pauses or small pullbacks as the rally matures.
Stellar Bullish Trend Intact, but Key Support at $0.279 Must Hold
Stellar’s Exponential Moving Averages (EMAs) are flashing strong bullish signals, with the short-term EMAs currently positioned above the long-term ones. This classic pattern reflects sustained upward momentum.
The next major resistance level sits around $0.30, a psychological barrier that could briefly slow XLM’s advance.
However, if Stellar manages to break decisively above $0.30, the path higher opens toward $0.349 and potentially $0.37, which would mark the first time XLM trades above $0.35 since March 2.
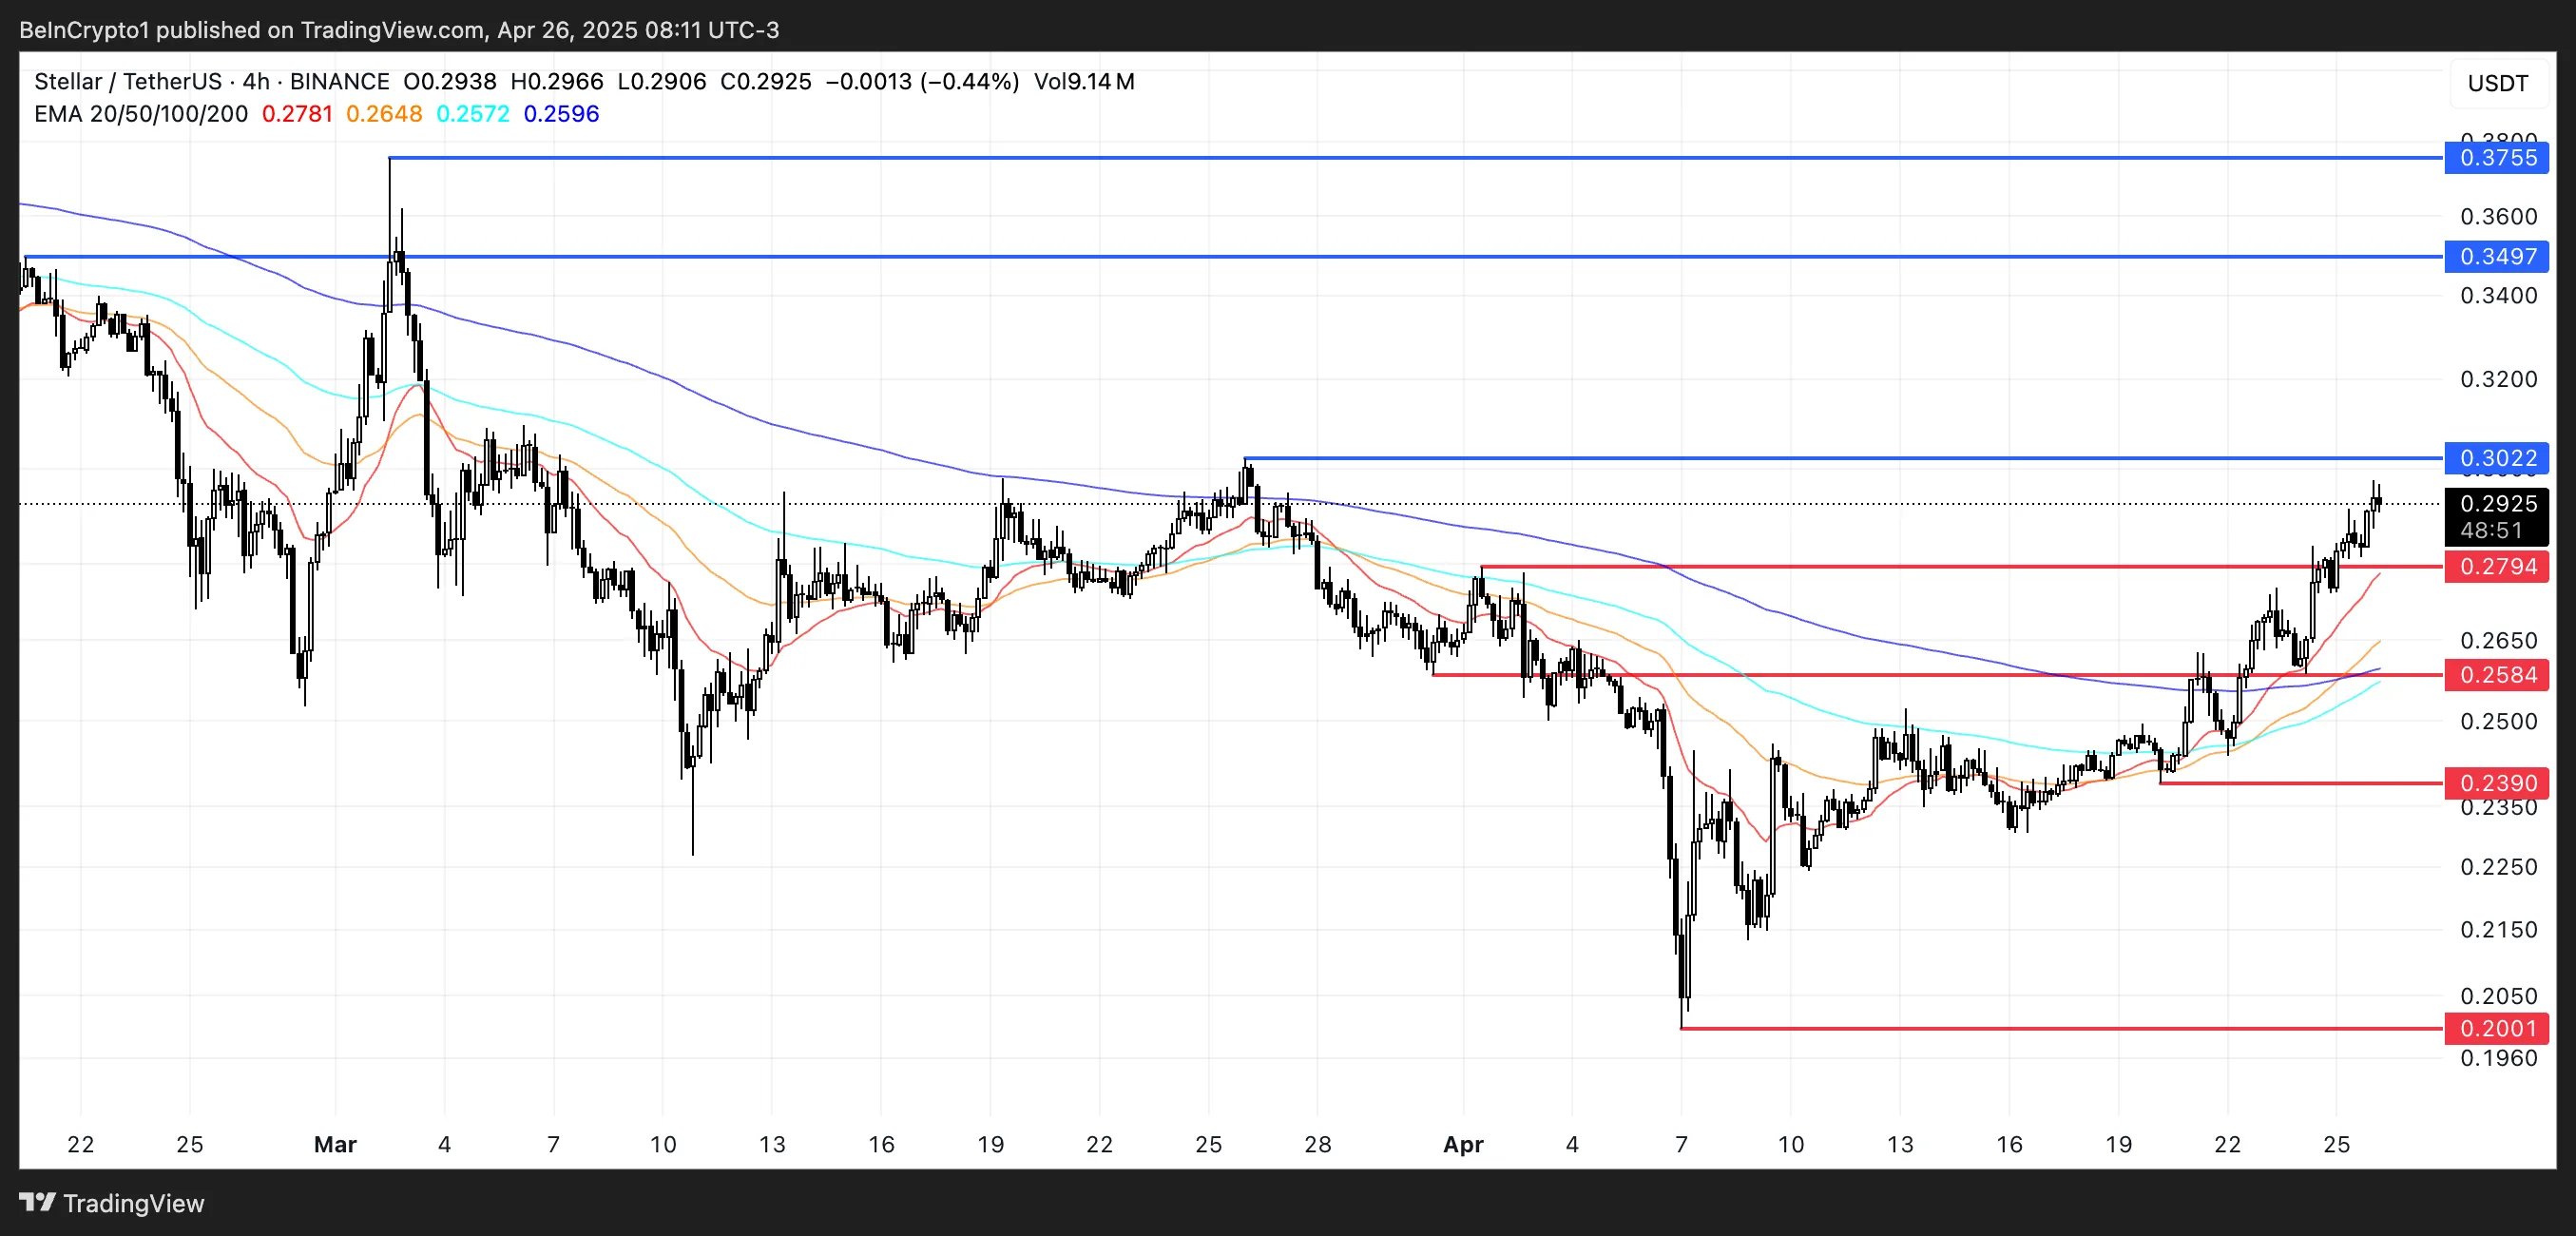
On the downside, the support level at $0.279 has become crucial for maintaining the bullish structure.
A successful retest of this support could serve as a healthy consolidation before another leg higher, but a clear loss of $0.279 could trigger a more meaningful correction.
If that happens, XLM price could slide toward the next major support at $0.258, and if selling pressure accelerates, deeper retracements toward $0.239 or even $0.20 are possible.
Disclaimer
In line with the Trust Project guidelines, this price analysis article is for informational purposes only and should not be considered financial or investment advice. BeInCrypto is committed to accurate, unbiased reporting, but market conditions are subject to change without notice. Always conduct your own research and consult with a professional before making any financial decisions. Please note that our Terms and Conditions, Privacy Policy, and Disclaimers have been updated.